Chemical weapon kills 50,000 in NYC; no one cares
For the last 3 years, there has been widespread media silence about the mass casualty event in New York City in Spring 2020 (the 4/20 NYC massacre), which killed over 50,000 people in 25 counties over 8 weeks, according to Centers for Disease Control (CDC) data. That’s 50,000 extra people, over and above the number who usually die in those 8 weeks. And when the press isn’t silent about it, they are usually covering it up—we’ll look at some examples here.
Is the mortality data from the CDC accurate and complete? Is it possible deaths have been falsified to simulate a mass casualty event? Here, I review some possibilities that were proposed recently, and narrow them down.
There were some smaller death surges elsewhere in the US (see details at 4/20 NYC massacre), but they were dwarfed by the mass casualty event in the NYC metro area. The chart below shows the weekly percentage increase in deaths in 2020 compared to 2019 in the 12 most populated states, which account for more than half of the US population. New Jersey (in dark blue) and New York (in red), the states where the NYC metropolitan area is located, stand out as The Place To Be in Spring 2020 for anyone with a death wish.
See Note 2 at this link for the source of this data.
There were apparently also simultaneous death spikes in Europe like the one in NYC, which I won’t be discussing here, but which should be considered when trying to decipher what actually happened.
Recap of the Spring 2020 Mass Casualty Event (MCE)
The chart below shows weekly deaths from 2018 through 2021 for 3 groups: deaths in New Jersey and New York state (in yellow); deaths in 25 NJ and NY counties with the most excess deaths, which is basically the NYC metropolitan area (in orange); and deaths in New York City proper (in red).
Can you spot the mass casualty event in this chart? If so, you have an extraordinary rare ability—one that’s never been seen in any public health official, all of whom suffer from undiagnosed Genocide Blindness Virus, often complicated by chronic Forked Tongue Syndrome.
See Note 1 for the source of this data.
Following is a summary of the total all-cause death numbers during the MCE, both the minimum (assuming an 8 week death surge) and the maximum (assuming a 13 week death surge). In either case, the Top 25 counties (the NYC metro area) accounted for more than 92% of all excess deaths in NJ and NY; while NYC proper accounted for a little under half. The table also provides death numbers during the surge weeks in 2018, 2019 and 2021, for comparison.
See Note 1 for the source of this data.
In the graphic below, you see a map of the location of the MCE, along with a table of the most affected counties—several with massive increases in deaths of over 500% in April 2020. By June, most death numbers had returned to normal.
See Note 3 at this link for the source of this data.
Notice the geographic cluster of excess deaths, with the highest number in the center of a region with extraordinarily high casualties for a short period of time—as if something toxic was released in the air in the vicinity of New York Harbor and spread to surrounding areas, gradually dissipating with time and distance from the epicenter. That’s just an observation of appearances, not a conclusion about cause and effect. Regardless of whether you think virology is a legitimate science or not, this event looks like it could potentially be a covert chemical weapon attack. Yawn.
Where are the terrifying mutated microbes escaping from foreign lands? Where is the line-up of shooting victims, family members and witnesses, eager to share their personal trauma and political agendas on camera and start a GoFundMe, who cry with white eyes and no tears? I suppose the secret extermination of tens of thousands is a real snoozer news story in comparison.
The verboten NYC mass casualty event
Almost all mainstream and alternative media is tiptoeing around the Spring 2020 NYC mass casualty event, and there are ongoing efforts to cover it up. Was it a botched attempt to simulate a ‘viral outbreak’ with a chemical weapon? Or did everything go exactly as planned? Is it possible the excess deaths didn’t really happen—that the MCE was fabricated to further some social engineering agenda? If so, why is it being covered up, with most people being completely unaware of it? Could it be some sort of complicated multi-layered psychological operation, or is the truth much starker and more primitive than that?

The NYC mass casualty event is an uncomfortable topic that conflicts with or complicates everyone’s agenda:
Media promoting the virology narrative
Viruses aren’t supposed to double, triple, or quadruple deaths in people of all ages overnight, pretty much equally across the board, then disappear in mere weeks, as happened in the NYC mass casualty event. Poisons and train wrecks do things like that, not viruses, so the MCE is an unwanted topic.
Plus, as I documented in The 4/20 NYC massacre, only 72% of excess deaths were officially attributed to the COVID19 fiction—the other 28% were attributed to a variety of other things including heart, blood, brain, lung and kidney problems—not something virology apologists want to have to explain.
Media promoting or attacking COVID19 vaccination
In mainstream media promoting the CVax, the topic of 2020 excess deaths is a difficult one, because it inevitably leads to the unpleasant question of why, in spite of huge increases in deaths in 2020 (“the year of the virus”), there were even more deaths in 2021 (“the year of the vaccine”).
Meanwhile, in alternative media, there is quite a bit on post-vaccine excess deaths—which are invariably attributed to COVID19 vaccines—but almost nothing on excess deaths pre-vaccine. How were the post-vax death waves different than the pre-vax death waves, shown in the chart below of weekly US deaths from 2020 through 2022? Nobody knows, as far as I can tell—and no one wants to.

See Note 12 at this link for the source of this data and a data table.
Media challenging the legitimacy of virology
If 50,000 people didn’t die from a virus, then what did they die from? I’ve been told there is some kind of consensus within the ‘no virus community’ that any excess deaths in 2020 were caused by mitigation measures, needless and hazardous medical interventions, and the general shutdown of society—or something along those lines. If there is such a consensus, it would explain the reluctance in the ‘no virus community’ to talk about the NYC mass casualty event, which obviously could not have been caused by those things—for one, because it was the only major metropolitan city where a death spike of that extraordinary magnitude occurred.
Media promoting the ‘weaponized virus’ narrative

The CDC Man/God who is said to have brought a virtual virus genome to life.
It seems like media promoting the “weaponized virus” narrative should be running with the NYC mass casualty event as evidence of the existence of a Super-Duper-Virus, even if it did peter out quickly. I haven’t seen any media running with it, but admittedly, I don’t pay much attention to this narrative, which requires a belief I don’t have that humans can breathe life into computer code.
Maybe Dr. Terrence Tumpey of the CDC, AKA “God,”who is said to have once brought the extinct Spanish Flu virus to life, will share some of his esoteric knowledge for transmuting the in silico into the real.

The recent revival of the weaponized virus narrative is likely a desperate effort to stop the exposure of virology’s woefully lacking and fatally flawed scientific foundation—an event that could potentially result in the upheaval of the entire medical industry as we know it, including the creepy childhood vaccination program.
The consequences of exposing the vulnerable underbelly of virology would be so profound, the powers-that-be are probably perfecting a virus replacement as we speak, just in case the worst happens—maybe a new Supermicrobe from Outer Space—we can call it SOS-1, SOS-2, SOS-3, etc.—terrifying super-microbes of unknown composition that can never be seen as a whole living organism, and cannot be purified, or proven to actually physically exist—like viruses, but scarier, because they’re alien.

Star Trek was nominated for Pfizer’s Nice Try but no Cigar Award in 2021, for its overambitious advertising campaign conflating vaccination and logic. Apparently, the Estate of Leonard Nimoy sued for Gross Postmortem Embarrassment, but the Court ruled the dead cannot be embarrassed for more than 24 hours after death, and awarded the Estate a mere $3,000 in damages (along with $350 in court costs and $2.7 million in attorneys’ fees).
The medical industry survived an upheaval like that in the 1930s, when the decades-long belief that bacteria caused flu was finally swept under the rug, along with all the vaccines designed to treat bacteria flu. It was replaced with the modern belief that viruses cause flu, and all the vaccines designed to treat virus flu. Some day soon, viruses, too, will be swept under the rug, along with the vaccines designed to treat them, and science will progress to outer-space supermicrobes, with futuristic Star Trek vaccines to treat them. It’s amazing how much the medical industry has progressed in the last 100 years, injection-wise.
Coverup and propaganda
Following are a few examples of why most people are totally unaware of the 4/20 NYC mass casualty event.
All deaths COVID
This clever video from the JAMA Network, published in October 2020, shows what seems to be basically accurate 2020 excess death data, with a large death spike in April 2020—but without revealing anything unusual happened in NYC. It features a rapidly changing US map of excess deaths, which leaves a false impression they were pretty evenly spread out across the country, without actually lying about it.
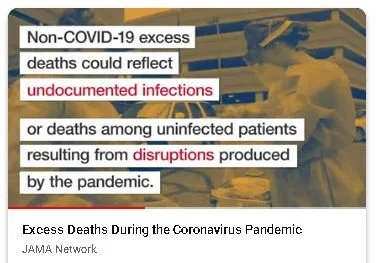
Surprisingly, the video is up-front about the fact that many excess deaths were not even attributed to COVID19—but then it hilariously concludes by suggesting that all the excess deaths not attributed to COVID19 were, in fact, caused by…COVID19, of course!
How exactly does that work? According to the video, it’s because non-COVID19 excess deaths “could reflect undocumented infections;” or could have resulted from “disruptions produced by the pandemic.”
The deaths could also have resulted from an infected toe acquired at Rodeo Clown College; or an accidental fall from a plaster dinosaur, in a reckless attempt to get Tom Selleck’s autograph—but of course they never tell you that part.
The bogus “retracted Johns Hopkins paper”

I previously exposed a little propaganda operation involving a Johns Hopkins article that allegedly proved 2020 deaths had been falsely inflated; the paper was soon retracted, as part of the operation. The incident was characterized in the mainstream media as preventing the spread of COVID19 misinformation, and in the alternative media as censorship of truth. In actuality, the paper claimed that deaths in 2020 were greatly overstated—while at the same time providing a tiny snippet of CDC mortality data—with just enough context for an interested investigator to confirm that deaths hadn’t been overblown at all—they had actually massively increased. Only someone who habitually hung out in WONDER would ever catch it—was it some kind of mockery?
I still see this bogus “retracted Johns Hopkins paper” mentioned all the time to back the claim that 2020 deaths were fabricated. It does exactly what it was designed to do—make anyone who cites it look foolish, to anyone who who knows better.

Rude Animal Doppelgangers: Eric Coppolino takes advantage of Ginny Stoner’s exhaustion from doing actual investigation to pussyfoot around the NYC mass casualty event.
Mass casualty event? What mass casualty event?
Tragically, even experienced investigative reporters have fallen victim to the dreaded Genocide Blindness Virus. Back in July, I tried to persuade New York-based investigative reporter Eric Coppolino that mortality was a number, not a belief, and he may want to check the actual mortality and excess death data before sharing his opinions about it. Sadly, I failed, and by September 14, Coppolino was on-air again, scoffing at the suggestion of excess deaths in the early days of the pseudopandemic.
In the clip, we’re told “the death line was basically flat,” and “there’s not an increase in deaths.” Whether he was talking about all-cause deaths, or just deaths attributed to COVID19, it’s incorrect—as I showed in The 4/20 NYC Massacre, about 36,000 of the 50,000 excess deaths in the NYC metropolitan area in Weeks 13-20 of 2020 were attributed to the COVID19 fiction.
NOTE: I usually include stutters in transcripts, because they may provide important information about the speaker,but I omitted them in this short clip because they were too distracting.
“I spent a fair amount of time on the World-o-Meter and got into a fair number of debates, over the normal view or the algorithmic view. Uh, but when you’re looking at the normal view, in other words the raw numbers, you could see that the death line was basically flat, but the case line was like, first it was Mount Ranier, and then it was Mount Everest, then it was K2. And meanwhile the red line on the bottom is just kind of bumbling along, flat. And you would have to ask yourself (well, if you were paying attention) how is that possible? How is it possible they’re claiming there are all these cases, quote-unquote cases, but there’s not an increase in deaths?
“Uh, and yes, if you break it in the log table, it was shown as a proportional increase—but that’s a reporting error, that’s not reality. Because none of these cases were real. Of course, if you’re reporting a bazillion cases, some portion of that is going to filter in to the number of people who died, when any death was being classified a COVID death, including heart attacks, fresh water drownings, car accidents. So, this is more than…uh, you know, there has never been a bigger scientific, quote-unquote scientific scam foisted on the human race.”
I’ll sum up the NYC mortality data in WONDER, just in case there is any lingering doubt about it:
According to the normal view—that is, the raw numbers, the death line wasn’t “flat,” it was through the roof. There were over 50,000 more deaths than expected in the NYC metropolitan area in Spring 2020, based on historical data. That’s not after “breaking it in the log table” or “shown as a proportional increase,” because that’s complete nonsense. It’s not a “reporting error”—it’s reality.

(NOTE: I asked ChatGPT to explain the “algorithmic view,” but it just told me to Google it. I searched Google, but Google just sent me back to Chat, and then Chat sent me back to Google…and so on, and so on, and so on, and now I’ve been stuck in an iteration loop for 3 days, listening to Chat’s constant “apologies for the confusion.”)
Was mortality data manipulated or fabricated?

It’s natural to question the integrity of the Centers for Disease Control’s WONDER database, given the CDC’s history of questionable integrity. I’ve looked at allegations of WONDER data fabrication before—in that case, I actually ended up being able to confirm that death numbers in WONDER for mid-March to mid-September 2020 did not change significantly between November 2020 and present. However, 50,000 deaths may not be “significant” enough to rule out in this situation.
Recently, Jessica Hockett raised the question here of whether the CDC may have manipulated or fabricated mortality data to simulate a mass casualty event in New York City in Spring 2020. She listed 5 possibilities, and I’m going to try to narrow them down here.
It’s interesting that Hockett, after realizing the “INSANE” (as she described it) 2020 mortality data wasn’t consistent with the “viral outbreak” narrative, didn’t go in search of another cause for the deaths, such as a chemical weapon—she went in search of evidence the deaths were faked. I’m not criticizing, just noticing—I suppose it’s a sign of the times. Or, maybe it’s that mass murder above a certain quantity is just too horrific to contemplate—especially when it just happened recently on your front lawn.
Limitations on data manipulation in WONDER
Following are a few issues and limitations I think would play a major role in an operation to manipulate death records in WONDER. However, I have a major disadvantage because I only know the database as a user, not as a programmer or manager.
HIGH RISK OF DETECTION: WONDER is a publicly accessible database for US birth, death and VAERS data, among other things. It’s used by thousands daily, including people in private industry, academia, at the CDC and in government, and interested members of the public, like me. Many users save searches and search results, both on their own devices and in the WONDER system, both digital and hard copies. That means any significant changes in existing mortality data will inevitably be noticed and documented by many people, both inside and outside the CDC, creating an inherent high risk of detection. So much so that I think any data manipulations or fabrications would have to appear “normal” to users.
WINDOW OF OPPORTUNITY: It seems to take 2-3 months from the death date to collect reasonably complete death records in WONDER, so any major data additions would likely be done within that time to avoid undue attention from WONDER users—the closer to the death date the better. After a few months, only occasional small additions to the number of deaths on any given date generally occur; however, these small additions could potentially continue, at a decreasing rate over time, for 1-2 years, until the data is finalized, without attracting a lot of attention.
Major data additions within 2-3 months of death date: Any large additions of data for the NYC MCE would probably have occurred between mid-March 2020, when the death spike started, and mid-July 2020, a couple months after the spike ended.
Minor data additions for 1-2 years : 1-2 years from ‘death date’ or until the data is finalized, at a declining rate over time. For the NYC MCE, minor, gradual changes could have been made to the mortality data until it was finalized in early 2022.
NO DATA SUBTRACTIONS: Reductions in the number of deaths on any given date, at any time, are very unusual in my experience, and would probably attract a lot of attention if they were for more than a few deaths, such as might occur due to errors in data entry and the like. While there are obvious reasons deaths may continue to be added as more data comes it, there is seldom a legitimate reason to remove it once it’s been entered.
Would counties and states be in on the fraud?

Before I go into Hockett’s possibilities, I wanted to note an overarching issue, which is the extent to which the states and counties would be co-conspirators in the fraudulent alteration of mortality data. The possibilities Hockett lists would create major inconsistencies between county, state and federal mortality data, unless they all colluded in the fraud.
Even if it’s not possible to obtain death certificates or detailed individual death information, it may be possible to obtain basic records such as how many deaths were recorded by the county or state in a given period of time, and compare it to the federal records in WONDER. It wouldn’t prove anything, but it would be useful information if you’re investigating whether the MCE may have been faked, and if so, who was involved.
Hockett’s possibilities
Hockett suggested 5 possibilities for the falsification of mortality data. I’m going to combine #1 and #2, as well as #3 and #4, because the issues are very similar.
1. Deaths that actually occurred before mid-March were pushed forward into the excess death period - anywhere from several weeks before several months or more.
2. Deaths that occurred in later April 2020 and/or thereafter in 2020 were “pulled back” into the excess death period.
If you look at the months prior to and following the NYC 2020 mass casualty event, deaths in NJ and NY look more-or-less typical compared to historical numbers. This is illustrated in the following 2 charts of monthly deaths in NJ and NY state from 1999 thru 2020, and a close-up from 2016 thru 2020.

See Note 2 for the source of this data.

See Note 2 for the source of this data.
If 50,000 excess deaths were “pushed forward” or “pulled back” into just 2 months of 2020, those excess deaths would have previously been spread out over the other 10 months of 2020, more-or-less. If you look at the total number of deaths in NJ and NY state in 2020, shown in the chart below, it is so huge in comparison to prior years, it scarcely matters how you push or pull or shuffle the deaths around—it’s a record year for deaths, regardless. Why execute a complex criminal scheme to make it appear as if the excess deaths all occurred in one colossal 8 week mass casualty event, that you then cover up? Maybe I’m just too tired, or not sneaky enough, to fathom the reason anyone would do that.

See Note 3 for the source of this data.
Because of the high risk of making any data subtractions, recording of these “pushed forward” deaths probably would have been delayed, then the death date changed to make it part of the mass casualty event. So, for example, a death that occurred in Kings County, NY, on January 15, 2020, may not be entered into WONDER until March 15, 2020, and the date of death changed.
Likewise, a death that occurred on August 15, 2020, might be “pulled back” in WONDER to April 15, 2020, 4 months before it actually occurred in real life.
My mind boggles contemplating the complexity of a plan like this, and the millions of conflicts it would create between county, state and federal death records, and reality. What purpose would it have served? I can understand fabricating a bunch of deaths in a given year to create the illusion of a pandemic, but I can’t understand why excess deaths occurring naturally in a given year would be shuffled around. What would be the point?
Hockett’s possibilites #3 and #4 seem more feasible, and concern the double-counting of deaths, based on the place of death:
3. Some deaths that occurred in one place of death (at home, in nursing home facilities) were double-counted as hospital deaths.
4. A portion of deaths in that occurred in hospice facilities at some point are in the hospital inpatient death numbers, thanks to the March 23, 2020 executive order that afforded dual-certification to hospice beds as hospital inpatient beds.

As I understand it, these possibilities would both require the fraudulent duplication of certain death certificates, with the only difference between the original and the duplicate being the place of death. Then, both would be entered into the WONDER database as if they were 2 unique deaths—in effect, splitting 1 death into 2.
I think this possibility could potentially be investigated with the existing search tools in WONDER—which, if this kind of duplication or splitting has occurred, should contain a lot of “death twins”—deaths that are identical in every aspect, except for the place of death.
Finally, the possibility Hockett considers least likely—#5, fabricated death certificates—seems like one of the most feasible possibilities to me, along with #3 and #4, provided the extra deaths were added to WONDER during the window of opportunity that would avoid undue attention.
5. Fabricated death certificates are in the data. This is less likely, but a potential scenario would involve sudden “dumps” of certificates and/or records that list only U07.1 as underlying cause with nothing else listed (i.e., incomplete death certificates).
As for incomplete death certificates, not so much. You can only have so many of those without attracting attention; for example, if someone searches for deaths in NYC in Week 20 by gender, and they pull up 150 male deaths, 140 female deaths, and 750 deaths of unknown gender—that’s going to be a problem. Or, if someone searches for deaths in NYC during the MCE by age group, and they pull up 10,000 deaths with age unknown, due to incomplete death certificates. I think fake deaths added to WONDER would have to include all or most of the standard information in a death certificate, or it would wreak havoc with WONDER searches.

One last comment
I’m admittedly skeptical of claims that mortality data in the CDC WONDER database may have been altered—not because it would be technically difficult, but because it would have to be done right under everyone’s noses. You can’t just dump data in WONDER and hope no one notices, because people would definitely notice. It would require a well-organized criminal scheme to alter government records without detection, in a database that is open to public scrutiny 24/7. That’s not easy.
***
Notes
1) A table of counties in the NYC Metropolitan area, the Top 25 affected counties, and counties in NYC is below. Citations are also below for the following searches: Run this search for weekly deaths in all counties in NJ and NY state. Run this search for weekly deaths in the Top 25 counties. Run this search for weekly deaths NYC proper.


2) Monthly deaths in NJ and NY state from 1999-2020: Citation is below. Run this search in WONDER.

3) Yearly deaths and death rate in NJ and NY state: Citation is below. Run this search in WONDER.
