US death peaks 2020-2021: Causes of death

This post is the third in a series in which I take a closer look at the characteristics of the death waves that crashed over the US in 2020 and 2021.
These death waves impacted different states at different times, and even different counties within each state—something that is important to keep in mind when considering the testimonies of medical and funeral workers. To see how much deaths changed in each state, in each month in 2020 and 2021, see the tables here.
Post 1: Places people died in 6 death peaks
In the first post, I identified the months and states where the highest increases in deaths occurred in the United States in 2020 and 2021—that is, the peaks of the death waves.
There were 6 peaks: in April, July and December 2020, and in January, August and September 2021. In those peak months, I selected a sample of states where deaths increased more than 60%. The purpose was not to do a comprehensive survey of excess deaths, but rather, to get a closer look at what was going on in the times and places where the most people were dying.
I also looked at the places people died in the death peaks, and saw that overall, 90% of excess deaths occurred in 3 places: among inpatients in medical facilities (55%); at home (23%); and in nursing homes and long term care facilities (12%). All 6 death peaks were similar in that respect; however, most of the excess deaths in nursing homes/long term care facilities were associated with the first peak in April 2020—aka the New York City mass casualty event.
Post 2: Excess deaths by age group in the death peaks

In the second post in the series, I looked at the ages of people who died during the death peaks. In all 6 death peaks, children under 14 were mostly unaffected—the exception was an increase in deaths among 5-14-year-olds in the August and September 2021 peaks.
In the 2020 death peaks, the percentage increases in death in all adult age groups 25 and older was similar across the board. So, although more older people died overall—as they always do—the proportional increase in deaths in all adult age groups was very similar.
That pattern began to change in 2021, when deaths among younger and middle-aged adults started to increase more than for older adults—peaking with the 35-44-year-old age group.
Causes of death
When you venture into the territory of causes of death, it’s easy to get bogged down in thousands of different causes, making it difficult to get any insight from it. I wanted to narrow it down to a small list of the causes of death that increased the most in the sample states in the peak months, and had the most impact on excess deaths overall.

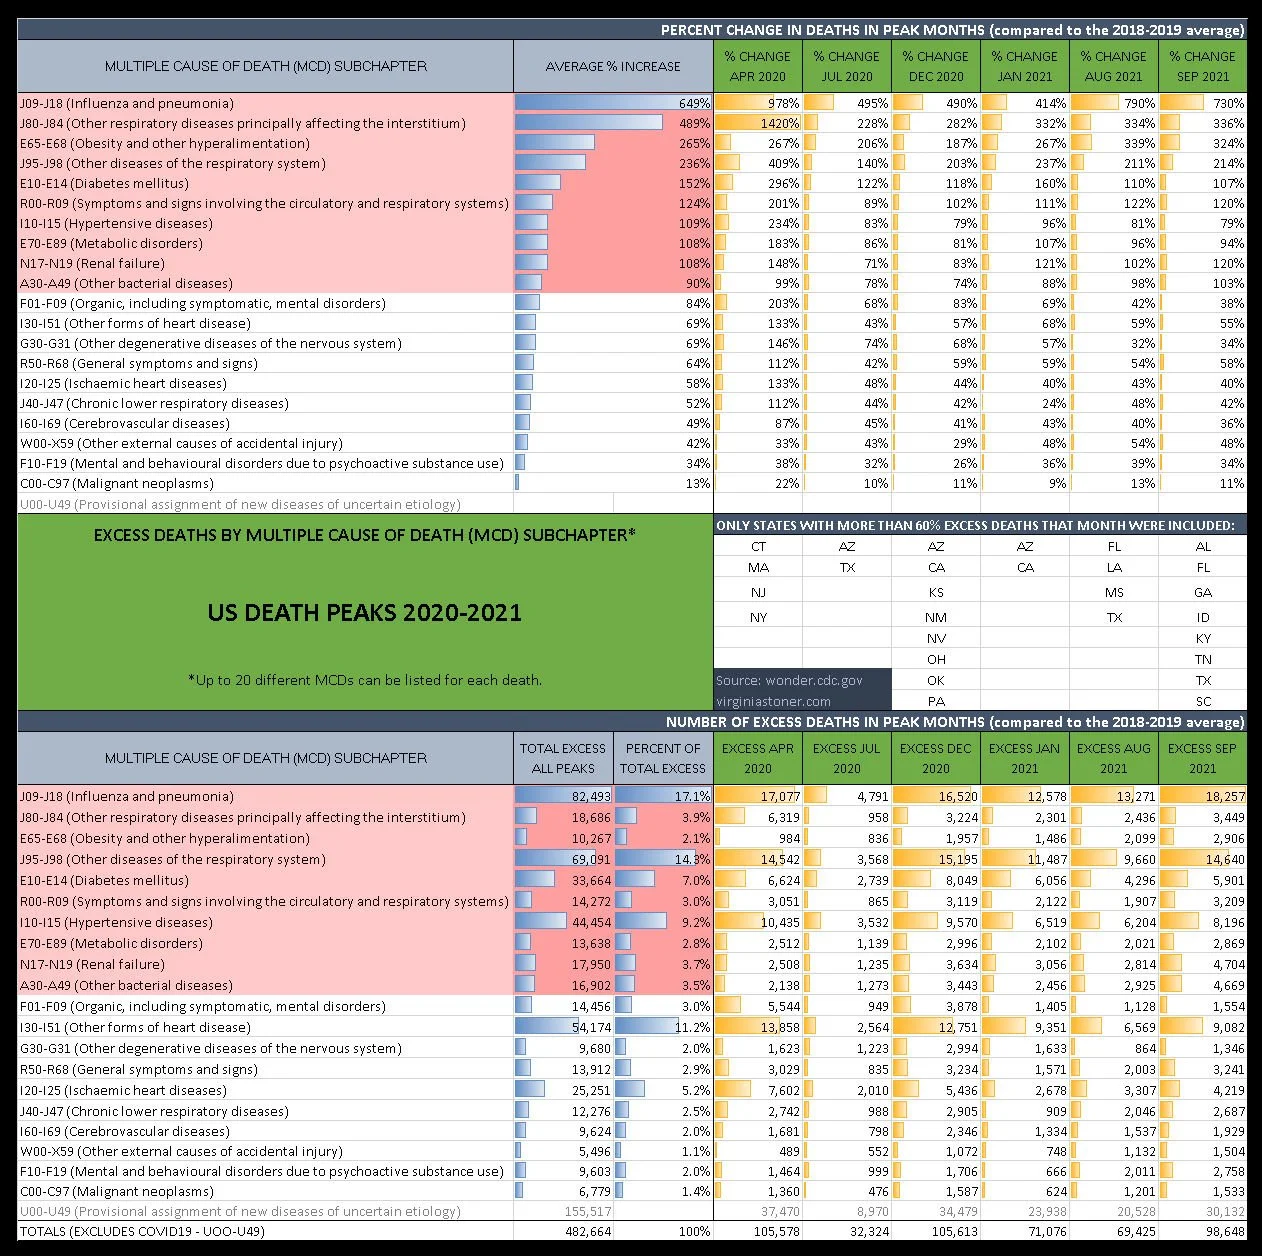
To do that, I started with a list of deaths in the sample states in the peak months by multiple cause of death (MCD) subchapter; subchapters are basically subcategories of causes of death. Each death can include up to 20 causes, so the numbers in the chart below are not a 1-to-1 count of deaths, but rather, a count of the number of deaths that listed a cause in that particular MCD subchapter.
To narrow it down to the causes of death that had the most impact, I eliminated all the subchapters that had less than 5,000 deaths total in all the death peaks. From there, I whittled it down further by eliminating subchapters that comprised less than 1% of total excess deaths in 2020-2021. What I was left with is the list in the chart below. In pink highlight are the top 10 MCD subchapters that increased the most overall (90% to 649%).
COVID19 and other questionable causes
For some of these subchapters, it wasn’t clear to me how they could constitute a cause of death, such as “Organic, including symptomatic, mental disorders”—how does a mental disorder cause death? But I’m not going to get into the issue here about what the MCD subchapters mean, or their legitimacy.
That includes COVID19, which is included in the chart below under subchapter U00-U49 (Provisional assignment of new diseases of uncertain etiology). I decided to ignore this MCD subchapter, since it is not possible to calculate the percentage increase in COVID19 because it didn’t exist as a cause of death in 2018 or 2019; and besides, this diagnosis totally dominates the numbers, without providing any real information about what caused the deaths. However, you can see in the lower part of the chart that COVID19 was listed as a cause of death in a total of about 156,000 deaths in the sample states in all the death peaks combined.
See Note 1 for the source of this data.
A general overview
The list of MCDs that had the most impact is notable for including many different organs and body systems, with an emphasis on respiratory issues.
It includes a number of causes related to respiration, such as influenza and pneumonia, chronic lower respiratory diseases, and other respiratory diseases. Of special note is the stunning increase of 1420% in deaths involving “other respiratory diseases principally affecting the interstitium” in the April 2020 peak—many times higher than in any of the other death peaks—although deaths were extraordinarily high in this subchapter overall. The only MCD subchapter that usually increased more during the death peaks is influenza and pneumonia.

The list of causes of death that had the most impact also includes deaths involving the heart, blood and circulatory systems, such as ischaemic heart diseases, other forms of heart disease, and cerebrovascular diseases. It also includes renal failure, diabetes, malignant tumors, and even mental disorders and substance use.
A note on preexisting conditions
Some of these MCDs would have had to exist well before the death occurred—things like obesity and chronic lower respiratory disease and heart disease don’t develop overnight, as far as I know, or in the span of an 8-week death surge. So, the causes of death may either have been directly caused by or exacerbated by whatever was killing people; or may indicate conditions that made people more susceptible to death from whatever was killing people.
***
NOTES
1) Multiple cause of death (MCD) subchapters that increased most during the death peaks. These searches have been saved in the CDC WONDER database, and are available at the following links. Citations follow.
April 2020 death peak: https://wonder.cdc.gov/controller/saved/D157/D376F819
July 2020 death peak: https://wonder.cdc.gov/controller/saved/D157/D376F905
December 2020 death peak: https://wonder.cdc.gov/controller/saved/D157/D376F948
January 2021 death peak: https://wonder.cdc.gov/controller/saved/D157/D376F909
August 2021 death peak: https://wonder.cdc.gov/controller/saved/D157/D376F910
September 2021 death peak: https://wonder.cdc.gov/controller/saved/D157/D376F913


