Excess deaths by age group: What, me worry?

Alfred discovers an unexpected benefit of COVID19 vaccination. “What, me worry?” —Alfred E. Neuman
If it seems like more young people than usual are dying these days, it’s because they are. If anyone tells you otherwise, they either don’t know what they’re talking about, or they’re lying.
The number of deaths that happen all the time on a regular basis, even just here in the US, is so huge, it’s almost unfathomable. 250,000 deaths each month may be just a drop in humanity’s bucket of immortal souls, but each of those numbers was once a unique and precious spark of life—and hopefully still is, somewhere.
There has been an unprecedented explosion of deaths in the US since April 2020, which I’ve written about before. As I’ll show in this paper, there have been over 1.5 million excess deaths, impacting all age groups, except babies and young children. In some age groups, including people as young as 25, there have been twice as many deaths some months as there were a couple years ago.
You may be wondering why hundreds of thousands of people dropping dead isn’t the biggest news story of the decade. Rest assured, we’ll be advised on a need-to-know basis by the creatures running the COVID show of the parameters of the ongoing genocide—because they care.

Meanwhile, the Centers for Disease Control (CDC) and Pfizer have teamed up to form an elite strike force to protect precious COVID19 vaccines from the rising tide of “died suddenly” reports. The ABV team (Anything But the Vaccine) is composed mostly of displaced nurses, academics, and nuns, who can deftly neutralize tragic stories of sudden death with a confusing barrage of medical jargon and statistics, complex insults in paragraph form, and plenty of good old-fashioned shaming.
The death data in this paper is from the CDC WONDER database. Keep in mind that all data from January 2021 forward is provisional, and the numbers are expected to increase. I’ve omitted death data more recent than August 2022, since IMO it’s still too incomplete to be very useful.
The predictable history of US deaths
Until 2020, the pattern of deaths in the US was remarkably consistent for at least 20 years, shown in the chart below. Deaths have been gradually increasing over the years with population, but for the sake of simplicity, I didn’t make any adjustments for that in counting excess deaths. So, bear in mind that a small number of excess deaths is not necessarily unusual or cause for alarm.
See Note 2 at this link for the source of this data.
Deaths also repeat a predictable pattern, where there are more deaths in winter than summer. There haven’t been any major deviations from this pattern until 2020. None of the previous virus terror campaigns—SARS in 2002; Avian Flu in 2003; Swine Flu in 2009; Ebola in 2013; Zika in 2015—caused even a blip in US deaths.
Expected deaths based on the 5-year average 2015-2019
To estimate the number of deaths that would have occurred in 2020, 2021 and 2022 if “something” or “some things” hadn’t happened, I used the 5-year average from 2015-2019. For example, I found the average number of deaths in each age group in January of each year from 2015-2019, and subtracted it from the actual number of January deaths in 2020, 2021 and 2022. Any deaths over and above those expected based on the 5-year average were “excess” deaths. See Note (1) for a data table.
A detailed look at monthly deaths in each age group from 2015 thru 2019 is shown in Chart 1 below. The risk of death steadily increases with age; the only exception is babies under 1 year old, who have a higher risk of death than other children under 15. Also, as people grow older, more tend to die in the winter months than in summer—but this pattern isn’t evident in children. The vast majority of deaths overall occur among people 45 years old and older.

Chart 1. See Note 2 for the source of this data.
2020: The year things went wonky
In Chart 2, I added deaths from 2020-2022, and it’s clear that the usual pattern of deaths was disturbed by “something” or “some things.” I’ve noted 3 events on the chart that stood out: an uncharacteristic surge in deaths in April 2020, when deaths would ordinarily be declining; a strong summer surge in deaths in August 2021, when deaths would ordinarily be low; and the introduction of COVID19 vaccines in mid-December 2020, coinciding with the largest winter death surge in history. These events occurred 8 months apart.

Chart 2. See Note 3 for the source of this data.
The April 2020 death surge
This was an unprecedented death surge that affected all ages 15 and older, and it occurred in a month when death numbers would ordinarily be declining, after a relatively mild winter death season. What caused it?
This question is important, because it couldn’t have been COVID19 vaccines, which weren’t released on the market until mid-December 2020. That is, unless there were some incredibly massive vaccine trials going on at the time. Or, if they were secretly spraying us with an aerosol vaccine. Nothing is really beyond the realm of possibility when creatures without a conscience (CWACs) are at the helm.

Was it COVID? The obvious explanation for the April 2020 death surge, per the official pandemic narrative, is that it was COVID19, caused by the virus SARS-COV-2. I don’t think that’s plausible, for reasons I’ve touched on before. In fact, I think if we did a basic research study in which we sent the same 20 specimens—some from healthy people, some from people with various illnesses—to 10 different labs, blind and with no information about the source, and asked each lab to identify whether each specimen contained a virus, and if so, which one(s), we would get 200 different answers—possibly less due to chance. I wish one of those rich people who are always offering rewards for debating the existence of viruses would fund a basic study like that, so maybe we could get some actual answers from science. It wouldn’t tell us what viruses are, or what they do, but it would at least tell us if they exist as a unique and identifiable organism.
People who do believe the official COVID19 narrative should think about a couple things:
The US death numbers didn’t show any indication of a pandemic until April 2020—long after the threat of COVID19 was announced in January 2020, and well after business closures, masking requirements and etc. had become widespread.
There were more deaths in 2021, post-COVID19 vaccine, than in 2020, during the height of the alleged pandemic.

Chart 3. See Notes 2 & 3 for the source of this data.
The December 2020-January 2021 vaccine and death surge
There is ordinarily a surge of deaths in winter—but December 2020 and January 2021 were record-breakers, for the older age groups. I frequently hear about how the COVID19 vaccine program, which began in mid-December 2020, targeted seniors aggressively, especially early on; this is offered by vaccine promoters as an explanation of sorts for the extraordinarily high number of deaths reported after the COVID shots, since older people are more likely to die ‘coincidentally.’ If so, this aggressive vaccination campaign was correlated with an unprecedented number of deaths among seniors age 65 and older. This is important information, although it doesn’t prove the vaccines caused the death surge—correlation can be indicative of causation (because causation always includes correlation), but isn’t necessarily.
The August-September 2021 death surge
This was another unprecedented surge in deaths occurring at a time when deaths would ordinarily be low. For younger adults, this surge involved a record number of deaths. It had a noticeable effect on deaths in every age group 25 and older, and so like the other death surges, seems to be a real effect from “something” or “some things.”
Excess deaths by age group
Deaths ordinarily increase incrementally with age—with the exception of babies under 1-year-old, there are more deaths each decade of life than in the decade before. Surprisingly, however, the excess deaths did not follow this pattern—they disproportionally affected young people ages 25-44. Even though the total number of excess deaths in the 25-34 and 35-44 age groups was a lot lower than for older people, the proportional increase in deaths was greater.
In the first chart in the set below, the orange columns show total excess deaths in each age group. There were no excess deaths among babies <1 year and young children age 1-4. The shorter colored columns show the average number of monthly deaths in the age group from 2015-2019, and are there to give context to the excess deaths.

Chart 4. See Note 1 for a table of the monthly averages, and Notes 2 & 3 for the source of this data.
For age 35-44, excess deaths equaled the number of deaths that would ordinarily occur in 14 months. For age 25-34, excess deaths equaled 11 typical months worth of deaths. Compare that to age 85+, where excess deaths for the entire 2-and-a-half years only amounted to the number of deaths that would ordinarily occur over 3 months. So, even though there were ‘only’ 94,000 excess deaths in the 35-44 age group compared to 253,000 excess deaths in the 85+ group, proportionally, the age 35-44 group was harder hit.
The following charts show more detail about the excess deaths in each age group—how many deaths each month from January 2020 thru August 2022 were over or under the 5-year average from 2015-2019.
Deaths were lower than expected for infants under 1 year old (due to declining births?). Deaths of young children age 1-4 appear unaffected by the “something” or “some things.” Deaths of children 5-14 may be elevated, but it’s not clear from appearances.

See Notes 1, 2 & 3 for the source of this data.
For younger adults, there’s no ambiguity—deaths are way up compared to the 5-year average.

See Notes 1, 2 & 3 for the source of this data.
For older adults, it’s also clear—deaths are way up. The surprise was the 85+ age group, which fared better than other adults—even having some months where deaths were lower than expected. Maybe that’s evidence that if you make it to 85, you’re pretty darned tough. Hopefully it’s not because a lot of them died off in the December 2020 vaccine/death surge.
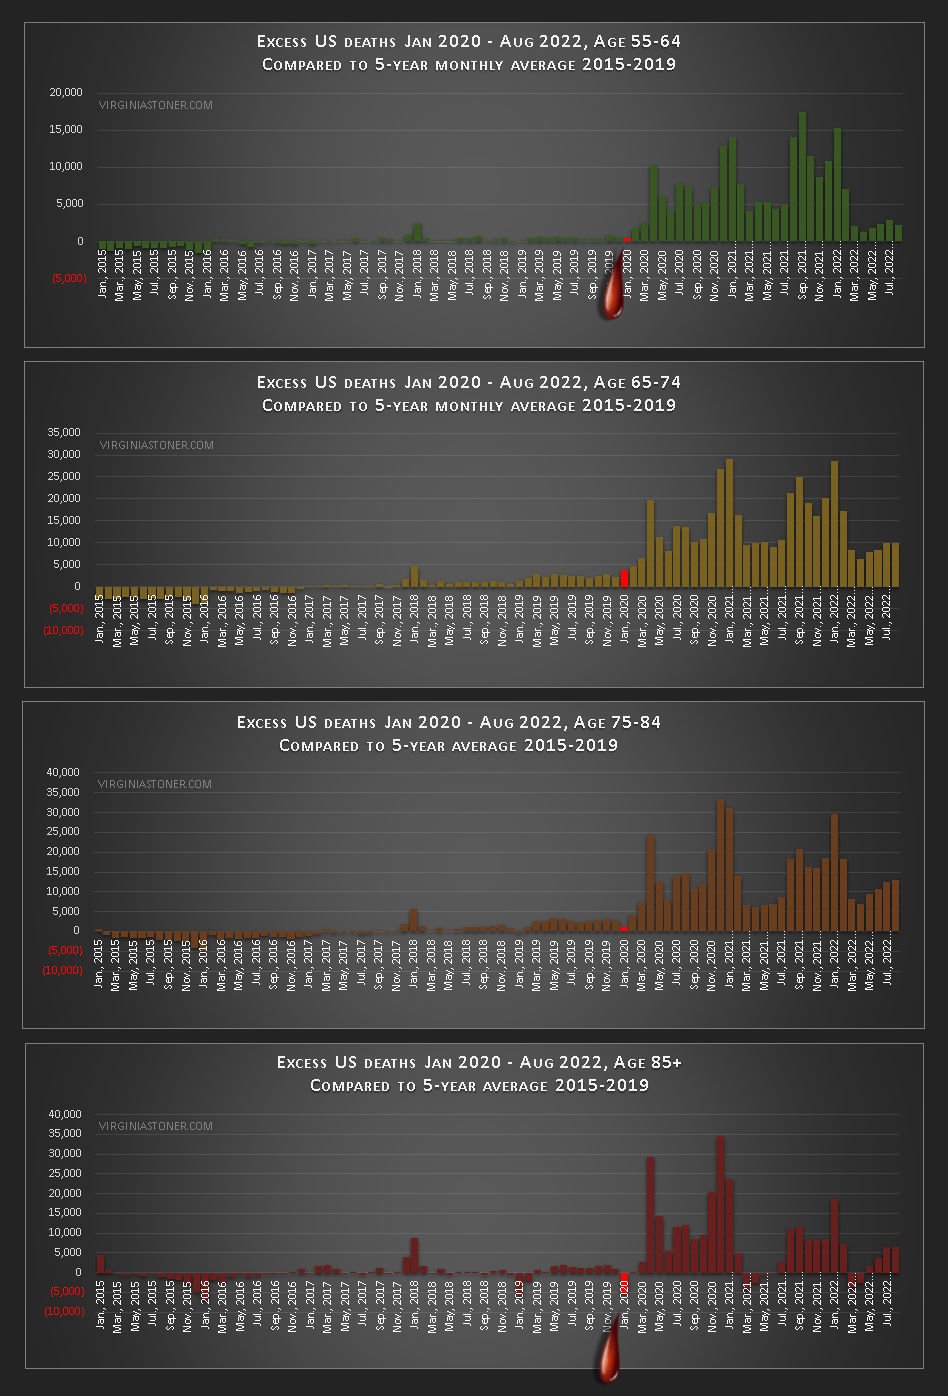
See Notes 1, 2 & 3 for the source of this data.
Closing thoughts
A lot more people than usual are dying in the US, and the same thing is happening elsewhere around the world. Why? I think we need to consider the idea that multiple factors could be involved, and in particular, that the vaccines could be working in concert with some other thing or things to destroy human health.
The 3 noticeable death surges in April 2020, December 2020, and August 2021 are a clue, even if I don’t know what they mean. The vaccines are obvious suspects for the second and third death surges, but what about the first one? Could the effects of closures, masks and other restrictions, along with dangerous COVID19 treatment protocols and lack of care for the elderly, be solely responsible for the April 2020 surge in deaths? Maybe.
5g is the “fifth- generation technology standard for broadband cellular networks, which cellular phone companies began deploying worldwide in 2019,” according to Wikipedia. Could it have something to do with the surge of deaths? The book The Invisible Rainbow: A History of Electricity and Life, by Arthur Firstenberg, says yes, but I haven’t read the book yet. I don’t really have any answers, only questions.
Whatever the reason(s) so many people are dying, the creepy thing is, hardly anyone knows about it, and no official health authorities are talking about it. I guess genocide by stealth is always safer for the CWACs carrying it out.
***
NOTES
1) Yearly excess deaths 2020-Aug 2022; and monthly death averages by age group 2015-2019. See Notes 2 & 3 for the source of this data.

2) US deaths from all causes by month and age group, 2015-2019. From CDC WONDER database, located here.


3) US deaths from all causes by month and age group, 2020-Aug 2022. From CDC WONDER database, located here.


