US births, 1995 through 2021
This short paper is for anyone who’s curious about the birth rate in the US; or who, like me, just likes to ogle gorgeous charts. The fascination probably has something to do with combining numbers and images to tell a story—there are not many ways in the universe to do that.
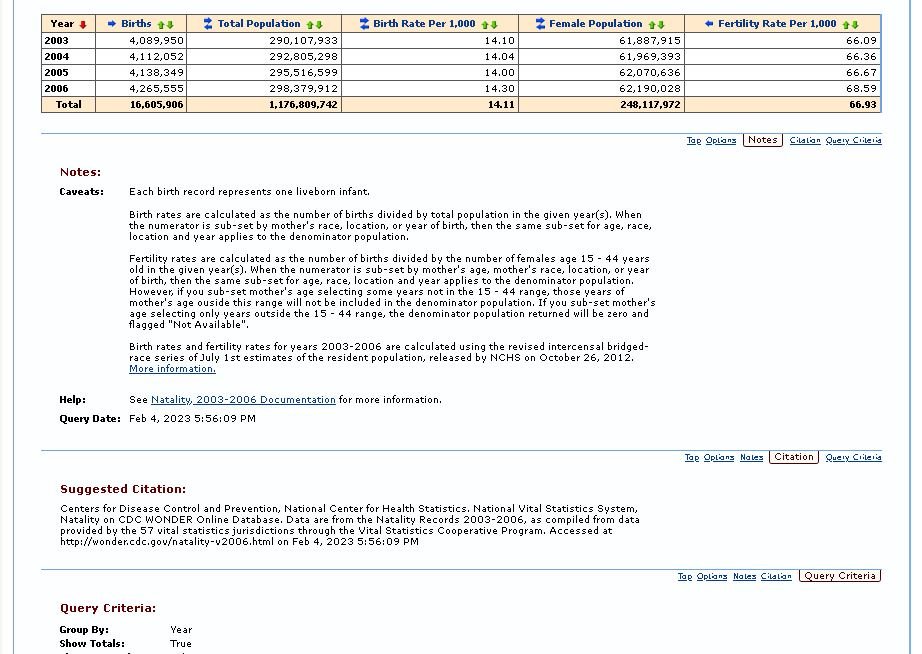
Here, I show US birth numbers from the Centers for Disease Control’s (CDC’s) WONDER database, which are available from 1995 through 2021 (data for 1995-2002, and for 2021, is limited).
It’s not possible to draw any conclusion about cause and effect simply from looking at numbers in a database like this. However, it is possible to identify issues that may warrant additional investigation.

See Note 1 for the source of this data and a data table.
For example, based on this chart of US population and births, a reasonable person might wonder whether ‘something happened’ in 2007 to abruptly reverse the trend in increasing births.
Was it caused by something manmade or natural, something physical, something social/psychological, or a combination of things? Was it purely coincidental, or part of a typical historical pattern we don’t have enough data to see here?
We can see that the number of births in the US has declined so much since 2007, that there have been fewer births in the last several years than there were in 1995, when the population was a lot smaller.
Birth rate and fertility rate
There are2 main ways to measure births, besides just counting them: the birth rate and the fertility rate. The birth rate per 1,000 is the number of births per 1,000 people, and is calculated by dividing the number of births by the total US population, and multiplying the result by 1,000. The fertility rate is the number of births per 1,000 women of child-bearing age, and is calculated by dividing the number of births by the number of women in the US aged 15-44, and multiplying the result by 1,000. Both the birth rate and fertility rate are only available from 2003-2020 in the WONDER database at this time.

See Note 1 for the source of this data and a data table.
We can see both the birth rate and fertility rate declined from 2007 to 2020—the fertility rate declined by about 19% and the birth rate by about 23%. So these are real declines in the rate people are giving birth, and not the result of a shrinking population.
The HPV vaccine series
A video by Virginia Stoner, the NWO Reporter
The CDC began recommending the now-controversial Human Papillomavirus (HPV) vaccine series for adolescent and teen girls in 2006, and for boys in 2011, according to the CDC’s history. This series of vaccines has often been suspected of interfering with fertility, based on medical research and adverse event reports.
If the HPV vaccine series can interfere with fertility, it could explain why births began a sharp decline after 2007. But, again, we can’t conclude anything about cause and effect just from looking at these numbers—we can only identify issues that may warrant further investigation. The possible connection between the HPV vaccine and the declining birth rate is one of them, IMO.
I think there are probably a lot of social engineering influences at work behind the declining birth rate as well—that’s based on my personal experience in grad school, where ideas for population control were a regular topic of conversation. But that’s a complicated subject for another day.
***
Notes
(1) US births and population 1995-2021. This involved 3 different searches in WONDER, starting at this link: 1 search for the years 1995-2002; 1 for the years 2003-2006; and 1 for the years 2007-2021. Citations, results and a data table are below.