The inconvenient April 2020 death surge; plus, twice the number of young men die
The April 2020 death surge
Since looking into the massive increase in deaths in the US from 2020 through 2022, now totaling over 1.7 million excess deaths, I’ve thought a lot about the first death surge that occurred in April 2020. A death surge of that magnitude had never occurred before, at least not in the last 2 decades—especially in spring, when deaths were historically lower than winter.

See Note 1 for the source of this data and tables.
This chart shows a close-up of the event, showing weekly deaths from February through June 2020 (in orange) compared to weekly deaths in 2019 (in gray), when deaths were at typical levels.
135,000 extra people died over 9 weeks in the April 2020 death surge (1).
It began in Week 13 (ending March 28, 2020), peaked at week 15 (ending April 11), and was pretty much resolved by week 21 (ending May 23). However, deaths remained higher than normal through 2022, and there would be more death surges to come.
The vaccines didn’t cause it
The April 2020 death surge is ignored a lot in both mainstream and alternative media, because it doesn’t neatly fit anyone’s narrative. Those warning people about the dangers of COVID19 vaccines don’t like to talk about it, because it occurred before the vaccines were available. Those promoting the vaccines don’t like to talk about it, because it raises the question of why there were 2 even larger death surges after the vaccines were introduced (more about that later).
As the chart below of deaths from all causes shows, whatever the COVID19 vaccines may have done, they didn’t decrease the number of deaths in the US, since over 80,000 more people died in 2021 than in 2020. (2)
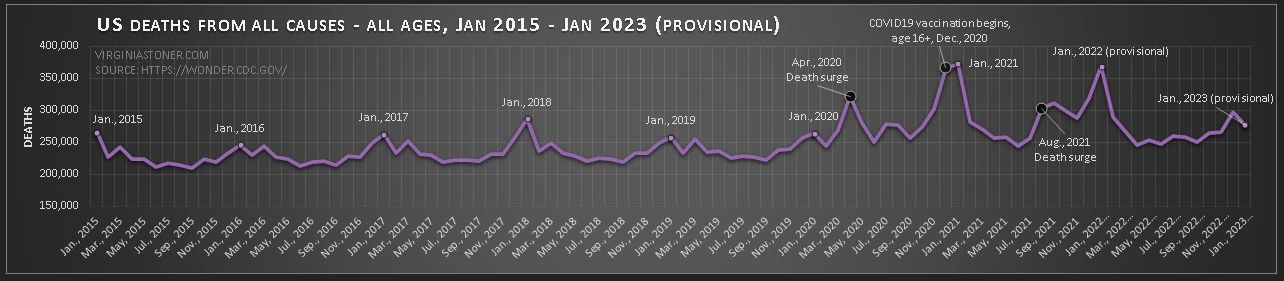
See Note 2 for the source of this data and tables.
A virus didn’t cause it
The April 2020 death surge was inconsistent with a virus being the cause—and not just because it occurred long after the usual winter ‘flu season.’ In June 2020, Dr. Denis G. Rancourt wrote a paper about this, which he summarized here. He looked at mortality numbers from the US and Europe, and found some interesting things, including:

No countries had experienced a noticeable increase in deaths before the World Health Organization (WHO) declared a pandemic on March 11, 2020.
Almost immediately after the WHO declared a pandemic, many countries all experienced a sharp simultaneous death surge that peaked and fell quickly, over several weeks.
Are we supposed to believe a deadly SARS-COV-2 virus spread stealthily around the world without killing anyone, then laid in wait to strike in force at an agreed time—which just happened to be right after WHO psychics declared a pandemic that hadn’t happened yet? Yes, of course we are.
Possible reasons for the April 2020 death surge
I’m listing several possibilities for the cause(s) here—as usual, I still have more questions than answers. Because the first death surge occurred in multiple countries around the world, it would be useful to know how similar these possible influences were in those countries. It would also be useful to know if subsequent death surges in the US also occurred simultaneously in other countries. And, it would be useful to know whether deaths were consistent across the US, or were limited to particular regions.
Toxic COVID19 treatment protocols causing premature death, such as dangerous drugs, and excessive use of ventilators.
Neglect of the elderly and others in need of care, due to fear of contagion.
Increased personal stress due to fear of death.
Hazardous ‘prevention’ strategies, such as constant masking and confinement indoors.
Some other environmental toxin, like electromagnetic radiation, or a chemical spill or intentional release.

Image source: https://www.cdc.gov/coronavirus/2019-ncov/lab/guidelines-clinical-specimens.html
What about COVID19 testing?
The COVID19 tests have always seemed creepy to me—inserting a probe deep into the skull to take scrapings seems like a very bad idea—based on my common sense, anyway. At the very least, it sounds very unpleasant.
Was there a legitimate justification for the mass administration of such an intrusive test? Was its real purpose to train people in deeper submission to authority? Was it possible it had an even more sinister purpose? I don’t know—I’m just noting the timing here: The first commercial ‘COVID19 test’ in the US was approved in mid-March 2020, with 2 million tests available for immediate use.

Image source: https://www.wired.com/story/fda-approves-the-first-commercial-coronavirus-tests-in-the-us/
Perhaps it was purely coincidence that a sudden surge of deaths soon followed, and I have no idea how many of the 135,000 extra people who died in the following 9 weeks were tested. It would be interesting to know—but I doubt it would be possible, based on my experience trying to research historical COVID19 testing data for this paper, which I eventually gave up on after many frustrating and wasted hours.
A note about the reliability of CDC WONDER and VAERS data
In CDC WONDER, death data going back to January 2022 is provisional, and is expected to increase before it’s finalized. The more recent it is the more it will likely increase.

There are no other publicly available sources of US mortality data to compare the CDC WONDER death numbers to, as far as I know. Nor are there any other vaccine injury databases that are freely available to the public, except VAERS.
Based on what I’ve seen, the pattern of deaths and vaccine injuries from many countries around the world is very similar to the US.
I’ve heard various beliefs about the reliability of the data—some believe deaths in WONDER have been under-reported, and some believe they’ve been fabricated. Some believe vaccine injuries reported to VAERS have been deleted, and some believe they’ve been fabricated. I haven’t seen any good evidence that any of those things are happening—although of course that doesn’t prove they aren’t. I’m just showing you what’s in the WONDER and VAERS databases, and what it might mean, to the extent it’s accurate.
Four “death surges” in all
While deaths in 2020, 2021 and 2022 were at unprecedented highs across the board for everyone 5 years or older in the US, there were 6 months with an exceptionally high number of excess deaths, comprising 4 “death surges”, circled in red on the chart of excess deaths below:
April 2020: 92,000 excess deaths
December 2020-January 2021: 117,000 excess deaths in December; 109,000 in January
August-September 2021: 82,000 excess deaths in August and 95,000 in September
January 2022: 105,000 excess deaths

See Note 2 for the source of this data and tables.
The April 2020 and August 2021 death surges were especially unusual in that they occurred in spring and summer, when deaths are ordinarily lower. The number of deaths is usually highest in January—but the 2 winter death surges were still notable for an exceptionally high number of deaths.
While the first death surge in April 2020 occurred prior to the introduction of the COVID19 vaccines on December 14, 2020, that’s not the case for the other death surges, and there are very good reasons to think the unprecedented number of deaths in 2021 and 2022 had something to do with the vaccines. For example, the fact that more deaths have been reported to the Vaccine Adverse Event Reporting System (VAERS) from the COVID19 vaccines in the last 2 years than from all other vaccines combined for the last 32 years. Click here for more information.

Click here for more information.
Mortality rates and VAERS reports increased to unprecedented highs after the vaccines were introduced. That doesn’t mean the vaccines caused deaths, but it’s an obvious hypothesis based on general knowledge of the sordid history of vaccination, and the fact the vaccines were a new type that had never been widely used in humans before.
It’s up to the CDC to reassure people that the correlation between COVID19 vaccines and all-cause deaths doesn’t point to causation—but so far, the official position is silence. By which I mean, the CDC repeats the standard “safe and effective” homily ad nauseam, but they’ve never explained the reasons for the massive increase in deaths in the US, or why VAERS death reports from COVID19 vaccines are so high. Touchy situations like that, if they must be mentioned at all, are better handled by public relations pros like Snopes and ilk, who don’t need to worry about accountability or FOIA requests.
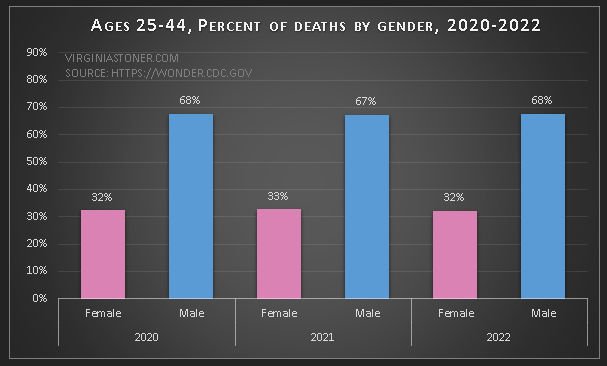
Ages 25-44: Twice as many men die as women
Although most deaths from 2020-2022 occurred among the elderly (as they always do), younger people were harder hit, in terms of the percentage increase in deaths. Click here for a complete age group comparison of excess deaths.
See Note 3 for the source of this data and tables.
The age groups with the highest percentage increase in deaths were ages 25-34, with 32% excess deaths from 2020-2022; and ages 35-44, with 43% excess deaths—meaning an incredible 43% more people in this age group died than expected.
I ran a search to see how many of the deaths among 25-44 year olds from 2020-2022 were men and how many were women, and got a very upsetting shock: twice as many men died than women!
But as it turned out, I shouldn’t have been quite so shocked—because when I compared 2020-2022 to historical numbers, I found that twice as many young men die every year—although there has been a small but noticeable increase in male deaths in the last few years.

See Note 3 for the source of this data and tables.
I suppose young men are just that much more reckless than women, but that’s just a guess. I haven’t looked into the causes of death, and haven’t done any gender comparisons in other age groups, so this is just a teaser for now, to puzzle over. I still find the disparity in deaths disturbing—but at least it’s ‘normal.’
***
NOTES
1) Weekly US deaths 2020 compared to 2019, data table and citations.

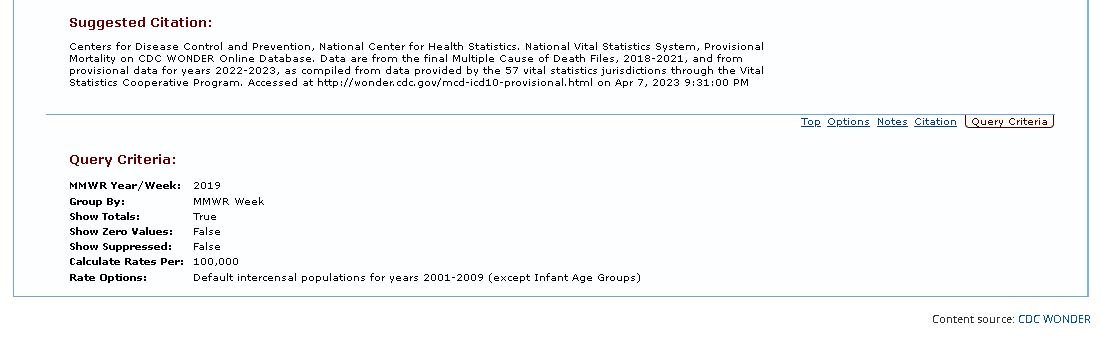

2) US monthly deaths January 2015-February 2023. Excess deaths were calculated by subtracting the average monthly deaths from 2015-2019 from the actual number of monthly deaths from 2020 to present.
Data tables:


Citation for deaths 2015-2020. Run this saved search.
Citation for monthly deaths 2021-present.

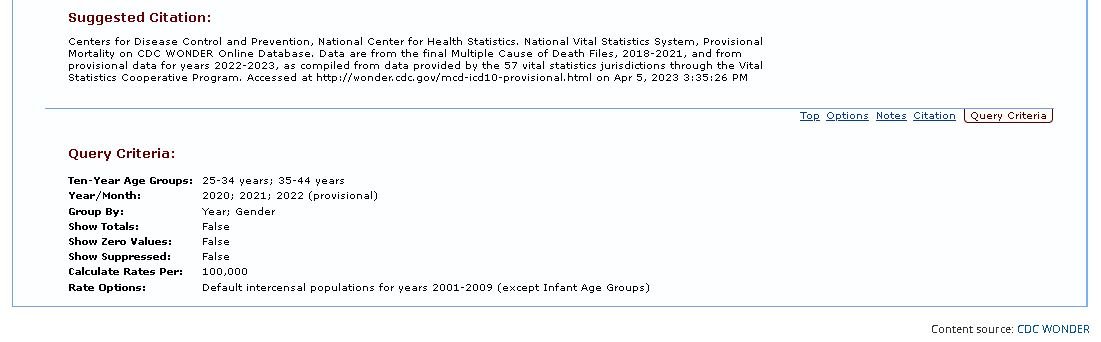
3) Ages 25-44 deaths by gender:
Data table:

Citation for deaths 1999-2020. Run this saved search.

Citation for deaths 2020-2022. Run this saved search.