An open letter to Mike Stone and Jamie Andrews about US mass-casualties in 2020
This Open Letter is a follow-up to our conversation in Mike’s forum early this year about mass-casualties in the United States in 2020, prior to the introduction of the Covid vaccines on December 14, 2020. Jamie also addressed this issue more recently, and I’ve included parts of that conversation as well.

We are in agreement that a virus did not cause any deaths in 2020, or at any other time, so this letter is not about that.
Rather, this letter is about your shared belief that investigating the cause of more than a half-million unexplained deaths in 2020 is a pointless or futile effort.
I aim to convince you otherwise here. While ultimate truths are never delivered on a platter, of course, I think you will be amazed at how much it is possible to discern about what could, and could not, have caused the mass-casualties in 2020, by examining US mortality records, and applying basic reason and logic.
I may be stating the obvious—but if we cannot figure out what caused the mass-casualties that followed the World Health Organization’s (WHO’s) declaration of a Covid pandemic on March 11, 2020, then we have no way of stopping the same mass-casualties from happening again, following the next pandemic declaration.
When that happens, the deaths will once again be blamed on a virus that your own investigations have shown does not exist—unless the real cause can be identified.
Basic yearly US death numbers

I am the author of The Illustrated US Mortality Guide: An objective and eye-opening overview of deaths in the United States from 1968 to 2023: Just the numbers. This concise reference manual makes it fast and easy for anyone, from high school students to professional researchers, to understand basic US mortality records. I have also written extensively about US mortality on my totally free blog for the last few years, with an emphasis on summarizing and demystifying the death records for average people.
According to the official death records, there were 528,891 more deaths in the US in 2020 than there were in 2019—a stunning increase of 19%, compared to the largest previous increases of just 92,940 (4%) in 1993, and 76,000 (4%) in 1980.
Deaths remained high in 2021, increasing another 2% that year, before declining dramatically in both 2022 and 2023.
CHART 1 shows yearly deaths recorded in the US from 1968 through 2024 (red line), along with US population (green columns). It is obvious from appearances alone that the “Covid years” were years of extraordinary mortality, compared to the last half-century.

CHART 1: US deaths and population 1968-2024. See Note 1 for the source of this data.
TABLE 1A shows the number of yearly deaths from 1968 thru 1995, and TABLE 1B shows the number of deaths from 1996 thru 2024. Both tables also show the population each year, the overall death rate per 100,000 people, the change in deaths from the prior year, and the percent change.
The percent change is highlighted with a red-white-blue gradient, with the highest increases in red, and the lowest in blue. Once again, the years 2020 and 2021 stand out as years of extraordinary mortality—followed by extraordinary declines in death in 2022 and 2023.
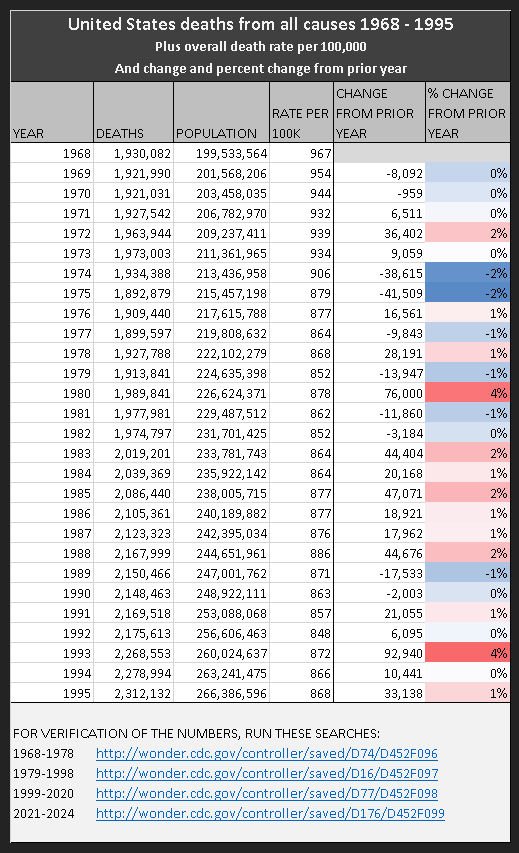
TABLE 1A: US deaths from all causes 1968-1995. See Note 1 for the source of this data.
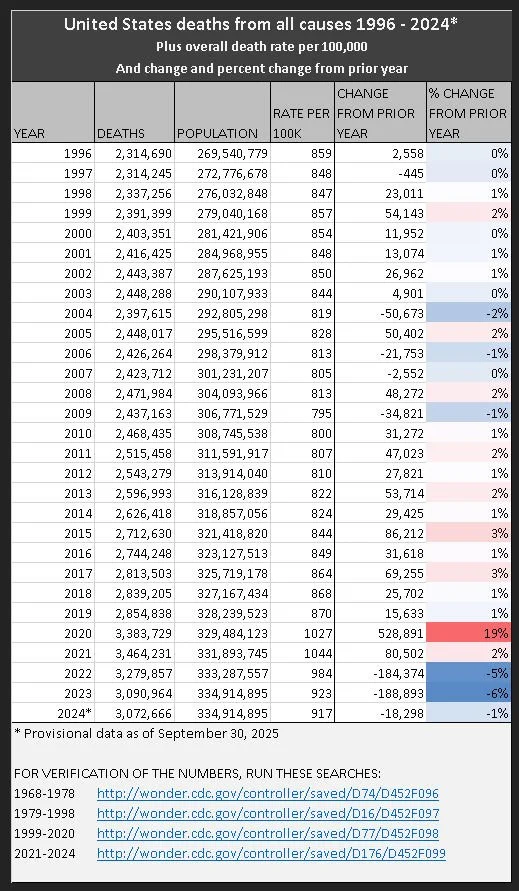
TABLE 1B: US deaths from all causes 1996-2024. See Note 1 for the source of this data.
You can quickly and easily verify that these numbers correctly reflect the contents of the official death records by using the links to saved searches provided in Note 1. More on the source of this data in a minute.
To be absolutely clear, these death numbers are not the result of any kind of statistical manipulation, nor do they have anything to do with the legitimacy of so-called “Covid deaths” or “Covid cases.” Nor are they estimates of “excess deaths,” a term of art used for calculations that involve discretion on the part of the researcher, which I demystified in this article.
Rather, these numbers are an objective count of all deaths of US citizens in the US recorded each year—regardless of cause of death or any other factors. They are a matter of record, not a matter of opinion—everyone who runs the same search in the mortality database will always get exactly the same results.
Fake death records?
Could the half-million-plus extra deaths in 2020 be fake? I realize neither of you made this claim, so I trust you agree it is not a feasible possibility—especially considering that, in the last 5 years, no one has made a serious case for it. But, I want to briefly address it anyway, since this claim comes up almost every time I raise the issue of 2020 mortality in an alternative media forum.

One person, named Jessica Hockett, is usually falsely credited with proving deaths in the official records in 2020 are fake—even though, as far as I can tell, Hockett herself has never made this claim, or any claim even remotely like it. In fact, the only deaths Hockett has looked at, at all, are 26k deaths in 5 New York counties in Spring 2020—concluding some undefined form of ‘data fraud’ or ‘staged event’ may have occurred there—whatever that means. Hardly a compelling reason to disregard mortality data from 3000+ counties nationwide, that points to the possible mass-murder of a half-million people.
If a half-million-plus deaths in the official records in 2020 are fake, it would constitute the largest criminal conspiracy to falsify government records in US history. If the death records are not fake, they confirm unprecedented mass-casualties in 2020—which, according to your research, could not have been caused by a virus, as we have been led to believe. Either way, it is the story of the century—or should be.
Localized death waves
Deaths did not simply increase across the board in the US in 2020—rather, deaths came in a strange series of localized and transient surges or waves, which primarily affected just a handful of states each time, while leaving other states unaffected or minimally affected.
For tables showing how much deaths changed in each state, each month in 2020, 2021 and 2022, see this link. But, keep in mind that deaths varied a lot, not just by state, but by county within each state as well—but that is beyond our scope here.

The Dancing Nurses propaganda operation?
This disparity of impact of whatever was killing people, depending on date and geographic location, explains why so many people within the medical and funeral and other affected industries can have very different impressions of what really happened in 2020, depending on where they were located, and when.
It explains why some nurses could have plenty of time to dance in the midst of a purportedly deadly pandemic—although it doesn’t explain why they would. Dancing Nurses was a propaganda operation, IMO, designed to help conceal the mass-casualties in 2020. It had that effect among alternative media followers, since it was widely viewed as evidence that the purported pandemic was just a hoax or a con, and deaths were normal that year.
CHART 2 shows the death surges in 2020—2022 (in blue), compared to deaths in 2019 (in brown), which are repeated each year for comparison. Notice how deaths in 2019 gradually decline toward summer, and gradually increase toward winter—the usual historical pattern for decades prior to 2020, as you can see on the free preview of the first page of Chapter 3 of my book.
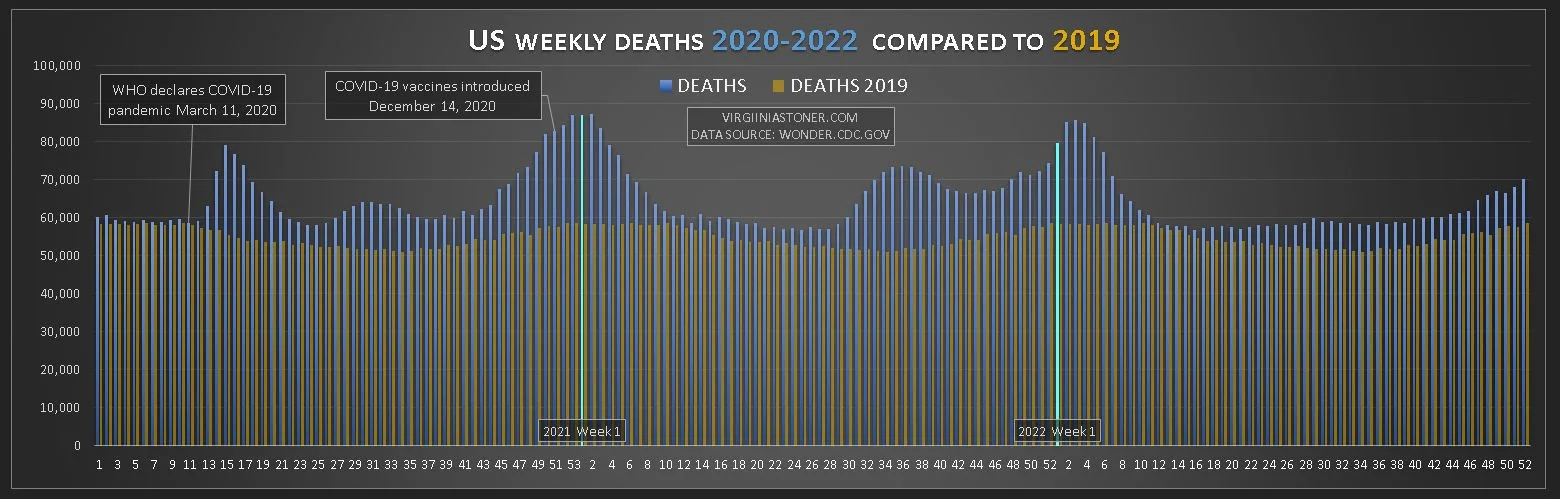
CHART 2: Weekly US deaths 2020-2022 compared to 2019. See Note 2 for the source of this data.
Investigation is futile?

There are three main narratives in use to explain What Really Happened in 2020—and all of them conflict with basic mortality data.
That includes the mainstream narrative that a dangerous virus is responsible for the increase in deaths, as well as the alternative narrative that harmful Covid response protocols are responsible, and the other alternative narrative that “nothing happened” in 2020, except mass-hysteria, and Covid was just a hoax or a con. For more on why all of these narratives conflict with the mortality data, read on. You may also want to check out my last article for an introduction to the issues.

Regarding identifying the cause of increased deaths, both of you share the same belief: That it is not possible to determine with sufficient certainty what caused deaths to skyrocket in 2020, and therefore, neither of you is going to try.
Mike thinks cause of death is too “complex” to “scientifically prove,” due to the “many variables involved”:

Mike also thinks trying to pin it down to a single cause is a “futile argument”:

Jamie thinks “lies, damned lies and statistics,” and “infinite variables” make an investigation of the mortality data “pointless”:

Jamie was also unclear about where the numbers showing a “massive” increase in deaths came from, and why he should pay any attention to them:

I’m going to explain where the mortality data comes from. Then, I’m going to focus exclusively on deaths that happened during the first death surge, in the 6 states where deaths skyrocketed. This more focused look at deaths in a time and place of highest impact provides a clearer picture of the effects of whatever was killing people.
Where US mortality data comes from
US mortality records are collected from death certificates issued in all 3000-plus counties nationwide, according to the Centers for Disease Control (CDC). This information is stored in a database known as WONDER, along with other public records, and is freely available to the public online.
No inconsistencies between county and federal death records have been found, to the best of my knowledge.
These records include a lot of information about each death, such as age, gender, when and where the death occurred, the place of death (at home, in a medical facility, or elsewhere), the Underlying Cause (UCD) each death was attributed to, and up to 20 Multiple Causes (MCD) believed to have contributed to the death. There are hundreds of standardized cause labels to choose from, which are organized by Chapter and Subchapter in the mortality database.
The WONDER database is the only comprehensive source of official US mortality data available to the public, and is where every other ostensible source of US mortality data, such as the United Nations (UN), the WHO, and private companies like Macrotrends, get their data—such as it is. The mortality data from these alternative sources is never as current or complete as the original source, may be selectively chosen to promote an agenda, and doesn’t come with the extensive search capabilities available in WONDER.
First death surge—a closeup
During the first US death surge, deaths skyrocketed for a few weeks, then gradually returned to normal over a total span of about 12 weeks. This 12-week surge began in Week 12 ending March 21, 2020, right after the WHO declared a global pandemic on March 11, and lasted through Week 23 ending June 6, 2020.
During the 12 weeks of the first death surge, there were about 149k additional deaths in the US, compared to 2019. More than half of them occurred in just 6 states: Connecticut, District of Columbia, Massachusetts, Michigan, New Jersey and New York. In these six states combined, there was an incredible 81% increase in deaths, compared to a mere 13% increase in the combined rest of the US. That includes a handful of states with moderately elevated deaths, as well as 30 states that had little or no increase in deaths at all during the first surge.
For a table showing how much deaths changed in each state, each month in 2020 (compared to the 2018-2019 average), see this page.
TABLE 3 shows a comparison of deaths during the 12-week surge in the 6 most impacted states, with deaths in the combined rest of the US. I think this table indicates we have a reasonably good separation of the hardest-hit areas—however, it is only intended as a rough estimate for purposes of discussion.

TABLE 3: Location of deaths in the first US death surge. See Note 3 for the source of this data.
CHART 3 shows weekly deaths in the 6 most impacted states during the 12-week surge (in orange), compared to deaths in 2018 (dark gray) and 2019 (light gray). Notice how deaths skyrocketed for a few weeks, then gradually returned to normal—resembling what is usually called a “normal distribution” or “bell-curve” pattern. This pattern is very unlike the steady, low weekly deaths in 2018 and 2019, and is indicative of a very deadly event of some kind, which had a clear beginning and ending.

CHART 3: Weekly deaths during the first US death surge, in the 6 states of primary impact. See Note 3 for the source of this data.
What causes are feasible, given this pattern of deaths? The dangerous virus narrative is so inherently flexible and creative, it would surely be easy to fashion a theoretical narrative to fit this pattern of death. However, it may not be possible to find mortality data to support it—since no one has managed to do it so far.
As for the alternative theory that toxic Covid response protocols are primarily responsible for the death surge, that is another story, because it raises at least 3 obvious questions that have to be answered, in order for this theory to be logically consistent with the mortality data.
First, if the same Covid response protocols were recommended nationwide, why were they only deadly in 6 states, while 30 states had little or no increase in deaths?
Second, why did deaths from Covid response protocols skyrocket, peak, then return to normal over a 12-week span?
Third, why did the same basic localized death surge pattern repeat itself twice more in 2020, elsewhere in the US?

Somewhere beyond Hope, Arizona. Photo © Virginia Stoner, 2019.
I have not seen any investigations intended to prove that toxic Covid response protocols are a more likely explanation for the death surge than, say, a chemical weapon, a dirty bomb, or some other as yet unidentified covert means of mass-killing.
Next, I look at certain characteristics of deaths that occurred during the first death surge in the 6 states of greatest impact, including the age of death, the place of death (at home, in a medical facility, or elsewhere), the Underlying Cause (UCD) each death was attributed to, and up to 20 Multiple Causes (MCD) said to have contributed to the death.
I think you will be surprised at how many clues about cause can be found in these simple summaries of the death records. They are not meant to be a deep or definitive dive into the data—just an introduction to a few basics. Yet, they have the potential to quickly narrow down the pool of possible causes, based on ordinary reason and logic.
Age of death
TABLE 4 shows the 10-year age groups of the people who died from Week 12 through Week 23 of the years 2018, 2019 and 2020, in the 6 states of maximum impact. The percentage change in 2020 compared to 2019 is highlighted with a red-white gradient, with the highest increases shown in red.
Notice that all adult age groups age 35 and up were similarly affected, all having a shocking increase in deaths between 70% to 90%. Whatever was killing people did not mainly affect the elderly, as we often hear.

TABLE 4: Deaths by 10-year age group in the first death surge. See Note 4 for the source of this data.
Children under 15-years-old had no increase in deaths at all in the first death surge—something that, unfortunately, would change by the time the Covid years were over, which I wrote about in this article about death rates during the Covid years and beyond.
However, deaths did increase substantially for younger people aged 15 to 34 (20% to 46%)—just not as much as it increased for older adults.
Places of death
During the first death surge, deaths increased the most for inpatients in medical facilities and residents of nursing homes/long-term care facilities—but deaths at home and in other places also increased substantially. Deaths in medical facilities—dead on arrival, and in hospice facilities, remained basically unchanged during the death surge.
TABLE 5 shows which places of death increased the most during the first 12-week surge, in the 6 states of greatest impact. The percentage increase in deaths is shown in a red-white gradient, with the higher increases shown in red.

TABLE 5: Places of death in the first death surge. See Note 5 for the source of this data.
This data suggests that at least some of the increased deaths during the surge were sudden and unexpected—resulting in 60% more deaths at home, 44% more emergency room and outpatient deaths, and 49% more deaths in “Other” atypical places.
However, deaths increased the most for inpatients in medical facilities (113%), and residents of nursing homes and long-term care facilities (104%). There are 2 possibilities, either or both of which could explain it:
Admissions to medical facilities and nursing homes skyrocketed during the 12-week surge, leading to more deaths due to more inpatients and residents, but not necessarily a higher rate of death among them.
Admissions to medical facilities and nursing homes were normal during the 12-week surge, but deaths among inpatients and residents skyrocketed.
It would require more investigation into medical facility and nursing home admissions to determine what actually happened here. However, it is certainly possible that at least some of the medical facility inpatient and nursing home resident deaths were also sudden and unexpected.
Underlying Cause of Death
The death records contain 2 different categories for cause of death: the Underlying Cause of Death (UCD), believed to be the main reason for the death; and Multiple Causes of Death (MCD), which include up to 20 different causes believed to have contributed to the death.
TABLE 6 shows the UCD listed in deaths in the 6 states of maximum impact, during the 12-week surge, along with deaths during the same period in 2018 and 2019. The increase in 2020 compared to 2019 is shown, along with the percentage increase, shaded with a red-white gradient, with the higher increases in red.
The first UCD Chapter listed, U00-U99 (Codes for special purposes) is mainly COVID-19. In 2020, about 58k deaths were attributed to Covid. However, there were about 77k more deaths in 2020 than there were in 2019—so only about 75% of the increase in deaths was attributed to Covid.
The rest of the additional deaths were mainly attributed to UCD in 9 other chapters:
Pregnancy, childbirth and the puerperium (120% increase)
Certain infectious and parasitic diseases (52% increase)
Endocrine, nutritional and metabolic diseases (40% increase)
Mental and behavioral diseases (33% increase)
Diseases of the circulatory system (30% increase)
Diseases of the nervous system (29% increase)
Symptoms, signs and abnormal clinical and laboratory findings, not elsewhere classified (26% increase)
Diseases of the skin and subcutaneous tissue (26% increase)
Diseases of the respiratory system (21% increase)
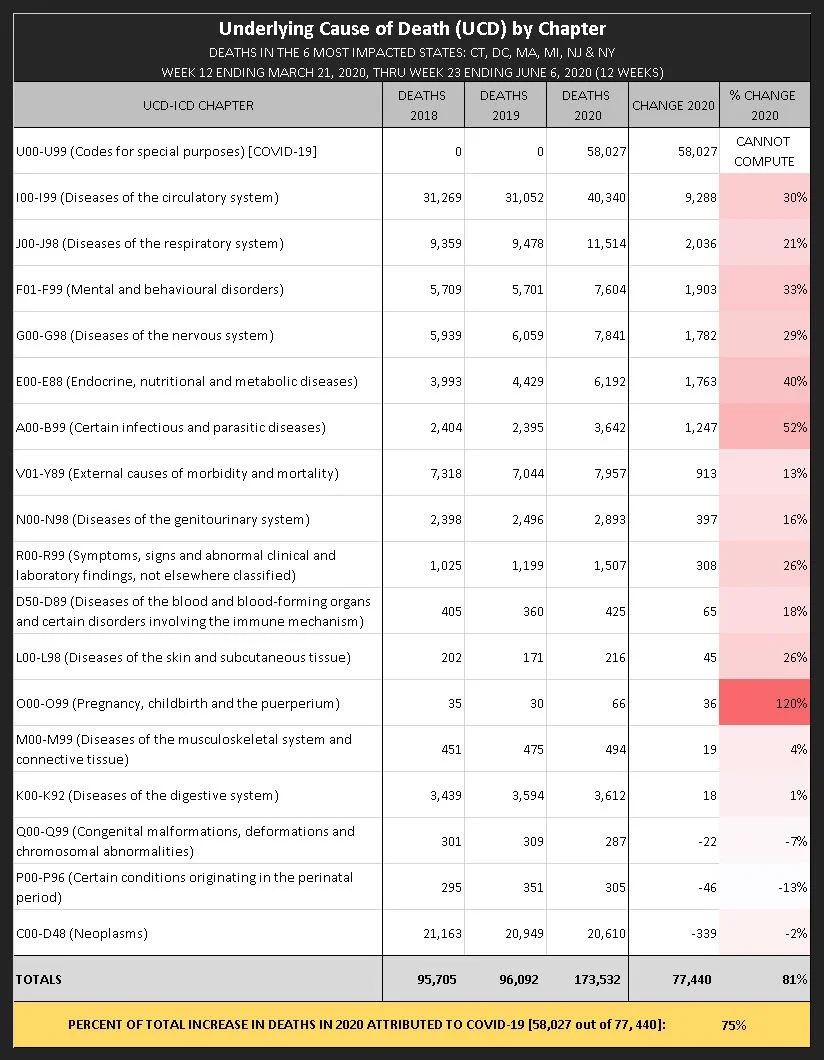
TABLE 6: UCD during the first US death surge. See Note 6 for the source of this data.
Remember, these are just the chapters containing the UCD listed in each death, and only provides a very general picture of the situation. More detail is needed to sort out what is going on—such as looking at the Subchapter and the specific UCD listed in each death.
Multiple Causes of Death
As I mentioned earlier, each death certificate can list up to 20 MCD believed to have contributed to the death. The fact that MCD listings increased a lot in so many different chapters suggests that the adverse effects of whatever was killing people were quite diffuse, affecting many different organs and body systems.

Again, it would be useful to look in greater detail at the Subchapter, and the actual MCD listed in each death—but for our introductory purposes here, I am going to stick just to the basic MCD chapter listings.
The first chapter on the list, U00-U99 (Codes for special purposes) is mainly for COVID-19, and this MCD was listed about 62k times. Since there were about 151k additional MCD listings overall (compared to 2019), only about 41% of the increase was attributed to Covid.
TABLE 7 shows how much MCD increased in each chapter in 2020 compared to 2019, along with the percentage increase, highlighted with a red-white gradient, with the highest increases shown in red.
Since MCD in so many chapters increased substantially, I’ll just summarize the 11 chapters in which they increased more than 50% (not counting Covid):
Diseases of the respiratory system (184% increase)
Diseases of the eye and adnexa (136% increase)
Endocrine, nutritional and metabolic diseases (109% increase)
Diseases of the genitourinary system (77% increase)
Diseases of the circulatory system (69% increase)
Certain infectious and parasitic diseases (68% increase)
Symptoms, signs and abnormal clinical and laboratory findings, not elsewhere classified (63%)
Diseases of the nervous system (62% increase)
Diseases of the musculoskeletal system and connective tissue (54% increase)
Diseases of the blood and blood-forming organs and certain disorders involving the immune mechanism (53% increase)
Mental and behavioural disorders (53% increase)
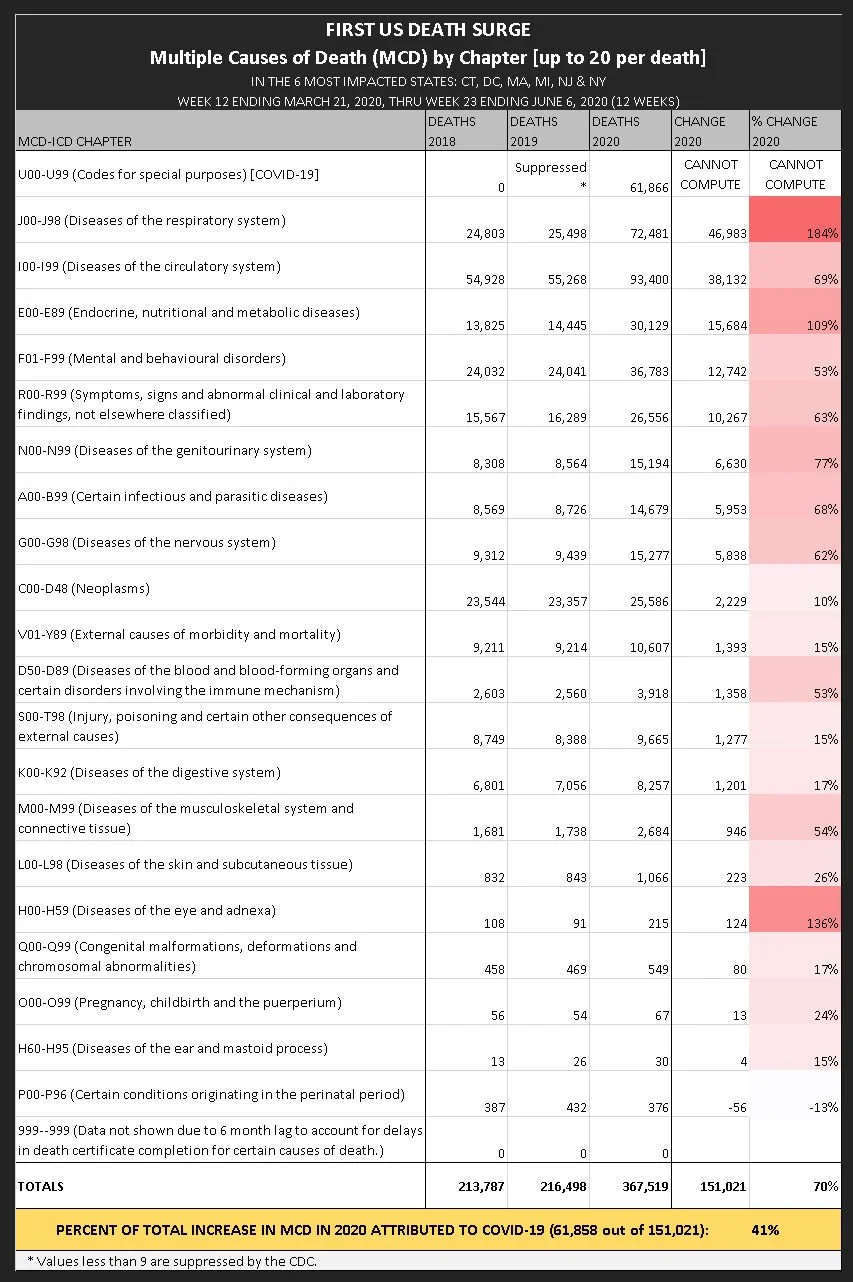
TABLE 7: MCD during the first death surge, in the 6 states of maximum impact. See Note 7 for the source of this data.
Criteria a plausible theory of cause has to satisfy
By focusing in only on deaths that occurred in the 6 states where deaths skyrocketed during the 12-weeks of the first death surge, we eliminated a lot of the “noise” from areas where nothing unusual happened, giving us a clearer picture of the effects of whatever was killing people.
Based on this close-up, we identified some criteria that any proposed cause of death must satisfy, in order to be considered plausible:
Can cause deaths to skyrocket and return to normal over 12 weeks in 6 states, while 30 states have little or no increase in deaths.
Can cause the same basic localized death surge pattern to repeat itself twice again in 2020, in different areas of the US.
Can increase deaths substantially and more-or-less equally in all adult age groups, while deaths among young children remain unchanged.
Can substantially increase deaths among medical facility inpatients and nursing home/long-term care residents, as well as deaths at the decedent’s home, among medical facility outpatients and ER patients, and deaths in “Other” less typical places.
Can cause deaths attributed to COVID-19 to skyrocket, along with deaths attributed to many other causes involving many different organs and body systems.
I’m going to work on the list of the candidates that are still a plausible primary cause of death during the first death surge, in light of this mortality data. For now, suffice it to say we are trying to explain a huge variety of health damage resulting in death, which was inflicted on adults young and old in 2020, from some cause as-yet unidentified.
NOTES:
Instructions for running saved WONDER searches:
Click the link provided to run the same search I did in the US mortality database. No account is required to access the database, just agreement to the terms of service with each use. To review the search criteria I used, go to the “Request Form” tab after the search runs. Please contact me if you have any problem or question about a saved search.
1) Chart 1, Table 1A and Table 1B. For historical yearly death, population, and death rate data, run these searches:
1968-1978 http://wonder.cdc.gov/controller/saved/D74/D452F096
1979-1998 http://wonder.cdc.gov/controller/saved/D16/D452F097
1999-2020 http://wonder.cdc.gov/controller/saved/D77/D452F098
2021-2024 http://wonder.cdc.gov/controller/saved/D176/D452F099
2) Chart 2. For weekly US deaths 2020-2022 compared to 2019, run this search: http://wonder.cdc.gov/controller/saved/D176/D455F622
3) Table 3, Chart 3.
For deaths in Week 12—Week 23 of 2020 in the entire US, run this search: http://wonder.cdc.gov/controller/saved/D176/D449F909
For deaths in Week 12—Week 23 of 2020 in the 6 states of maximum impact, run this search: http://wonder.cdc.gov/controller/saved/D176/D449F903
4) Table 4. For deaths by 10-year age groups during the first 12-week surge in the 6 states of maximum impact, run this search: http://wonder.cdc.gov/controller/saved/D176/D456F266
5) Table 5. For place of death during the first 12-week death surge in the 6 states of maximum impact, run this search: http://wonder.cdc.gov/controller/saved/D176/D449F931
6) Table 6. For Underlying Cause of Death (UCD) during the first 12-week death surge in the 6 states of maximum impact, run this search: http://wonder.cdc.gov/controller/saved/D176/D450F015
7) Table 7. For Multiple Cause of Death (MCD) during the first 12-week death surge in the 6 states of maximum impact, run this search: http://wonder.cdc.gov/controller/saved/D176/D450F016