The very odd August 2021 death surge
Join our free email list here.
Before 2020, deaths had a remarkably consistent seasonal pattern in the US. Deaths were higher in winter, and lower in summer; the numbers were gradually increasing with population, but there were no real surprises from year to year. Monthly deaths from 1999 to 2019, when viewed in a chart like the one below, form a predictable scalloped pattern, with deaths peaking in January each year.

See Note 1 for the source of this data.
This predictable pattern of deaths went totally wonky in 2020, and stayed strange through at least early 2022, as you can see when we add recent years to the chart. Suddenly, after 2 decades of predictability, there wasn’t really a pattern anymore—deaths were all over the place. Why? It wasn’t our first rodeo with a dangerous virus narrative, and Zika, Ebola, Swine flu and such never caused a glitch in the typical pattern or quantity of US deaths.

See Note 1 for the source of this data.
I think the disruption in the usual pattern of deaths in 2020-2022 means something—it’s a clue about the reason or reasons for the unprecedented increase in the number of US deaths.

See this link for information about excess deaths.
That’s why I’ve been examining four extraordinary “death surges” that occurred in 2020-2022. Two of those death surges were especially odd, the ones in April 2020 and August 2021, because they occurred in spring and summer, when deaths are historically lower. The other two surges occurred in December 2020 and January 2022, when deaths are ordinarily higher, but they were still notable for the exceptionally high number of deaths in those months.
I previously wrote about the first death surge, which occurred in April 2020. This surge was mostly focused in New York and New Jersey, where an incredible 40% of all excess deaths in the US during the surge occurred.
The second death surge, which began in December 2020, impacted California more than any other state, although deaths were higher than usual overall across the US.
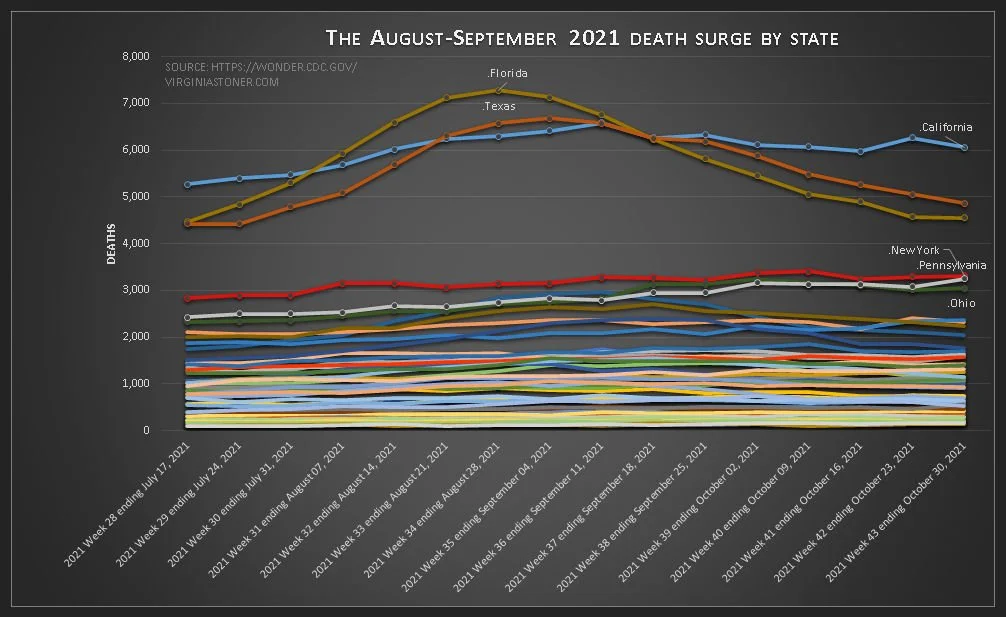
This paper looks at the third death surge, shown in the chart below, which occurred in August-September 2021. This surge killed an additional 188,000 people in the US over 10 weeks, compared to 2019.

See Note 2 for the source of this data.
Before I ran the numbers, I cynically predicted it would be Florida’s “turn” to be the epicenter of death. I wasn’t really surprised to be right, as you can see in the chart below. Texas was also hit with a death surge, along with a number of smaller states, especially in the South. There are charts with details about excess deaths in certain states later on.
See Note 2 for the source of this data.

See Note 2 for the source of this data.
Many states had a lot of excess deaths during this surge, which lasted approximately 10 weeks, from Week 31 through Week 40 of 2021. Excess deaths were extremely high in several states, like Florida, which had an incredible 70% excess deaths, compared to 2019. The 22 states with excess deaths over the US rate of 36% are highlighted in red in the middle section of the table to the right.
The third table section shows each state’s percent of US deaths in 2019 compared to 2021, and its percent of total US excess deaths during the 10-week surge period. Increases of 1% are highlighted in yellow; increases of 2% are highlighted in light orange, and increases of 3% or more are highlighted in dark orange.
Two states stand out as having had extraordinary death surges: Florida and Texas, which were responsible for a combined total of 26% of all excess deaths in the US.
Following are some selected state comparisons of deaths during the August 2021 surge, and deaths in 2019.
There were about 26,000 excess deaths in Florida, a 70% increase over 2019. 14% of excess deaths in the US during the surge occurred in Florida.

See Note 2 for the source of this data.
There were about 23,000 excess deaths in Texas during the surge, a 62% increase over 2019. 12% of excess deaths in the US occurred in Texas.

See Note 2 for the source of this data.
California may have experienced something of a “surge,” but during this time period, its percent of US deaths (9%) did not increase over 2019, and it accounted for only about 8% of US excess deaths. There were about 14,000 excess deaths in California during the 10-week surge.

See Note 2 for the source of this data.
Alaska had the highest percent of excess deaths during the August 2021 surge, at 71%—but with only 591 excess deaths, it barely registered in the national totals.

See Note 2 for the source of this data.
Georgia had about 10,000 excess deaths over the 10-week surge, a 63% increase over 2019. Georgia’s share of US deaths also increased from 3% in 2019 to 4% in 2021, and 5% of excess deaths in the US occurred in Georgia.

See Note 2 for the source of this data.
Alabama had over 5,500 excess deaths, a 57% increase over 2019, and accounted for 3% of all excess deaths in the US during the surge.

See Note 2 for the source of this data.
As a final example, Tennessee had over 7,500 excess deaths (54%) and accounted for 4% of US excess deaths during the surge—more than its expected share of 3%.

See Note 2 for the source of this data.
Observations and thoughts
A remarkably similar death surge pattern occurred simultaneously across multiple states in August-September 2021. Deaths began to surge and then decline at approximately the same time everywhere, and it occurred at a time of year when deaths are ordinarily at a low point. The fact these death surges were so similar across multiple states almost certainly indicates they had the same cause.
The death surge pattern isn’t consistent with a virus, according to the standard virus narrative. If it were, we’d expect to see surges of death occurring at different times in different states, and lasting various lengths of time, as the virus gradually spread via contagion. That’s not what happened here—the same death surge occurred simultaneously in multiple states, at the same unusual time of year.
This death surge seems oddly specific — as if it were a response to particular triggering event. It could be many things—it could be a particularly bad batch of vaccine, for example. If it was an environmental toxin, it would have to be one that was all around the country, including Alaska—electromagnetic radiation, for example. Could it be some other product that was widely distributed at that time?
Again, I end with more questions than answers. What do you think?
***
NOTES
TIP: To run a saved search in WONDER, click the link and agree to the terms of service. If the search does not run automatically, hit the Send button.
1) For deaths from 1999-2019, run this search. For deaths from 2020-2022, run this search. Citations are below.


2) For 2021 deaths by state, run this search. For 2019 deaths by state, run this search. Citations are below.

