The December 2020 death surge: stranger and stranger
Join our free email list here.

See this previous post for the source of this data.
First, more on the April 2020 death surge
In my last paper I wrote about the April 2020 death surge in the US, which lasted about 9 weeks, from Week 13 through Week 21, and resulted in about 135,000 more deaths than the same period in 2019.
When I compared the April 2020 death surge numbers by state, shown in the chart below, it was obvious New York had been slammed with deaths, along with New Jersey, to a lesser degree. It was unclear from appearances whether any other states had experienced a surge in deaths during that period.

See this previous post for the source of this data.
Since then, I took a closer look at the numbers in states that looked as if they may have been affected, and found that NY and NJ were in fact the only states that experienced a dramatic surge of deaths in April 2020.
Deaths elsewhere in the US were higher overall during that period than they were in 2019. A few states, such as Illinois, Michigan and Massachusetts, had what could be called a mini death surge. But for the most part, the death increases were spread out and not concentrated in any particular state—except NY and NJ. In those 2 states, deaths were heavily concentrated, with over 55,000 more people than usual dying in a span of just 9 weeks, comprising an astounding 40% of all excess deaths in the US during that time period, shown in the table below.

In 2019, deaths in NY comprised about 5% of total US deaths during weeks 13-21; in 2020, they comprised 10% of US deaths, and an incredible 28% of excess deaths. Deaths in NJ have similarly shocking numbers.
Increased deaths were so heavily concentrated in NY and NJ, it gave the impression of a local covert terror attack, such as contamination of their water or air supplies, for example. But surely if that happened, somebody would say something…right?
Maybe New York’s water fluoridation control system malfunctioned, dumping an extra helping or 2 of toxic sludge into the water supply. But surely if that happened, somebody would say something…right?
I wonder what sordid details about the Great New York Death 2020 are buried in the bowels of the Department of Defense (DOD). Because given the DOD’s job, they’d better have some sordid details about a mass die-off event that claimed the lives of 55,000 people in a small region of the country in just 9 weeks.
The December 2020 – January 2021 death surge: “The Virus” moves to Hollywood, leaves when it can’t find affordable housing
The second of 4 distinct death surges that occurred from 2020 through 2022 started around Week 47 of 2020 and continued for about 13 weeks, through Week 6 of 2021. This death surge resulted in almost 285,000 excess deaths, compared to the same period a year earlier.
In the chart below, the December 2020 death surge is shown in orange, with 2019-2020 comparison numbers shown in gray.

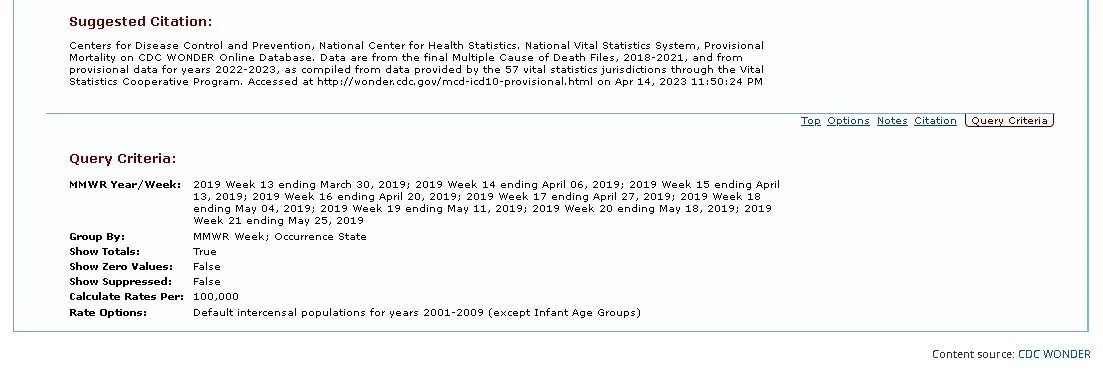
See Note 1 for the source of this data.
I decided to call this event the Great California Death 2020—look at the chart below of state-by-state deaths and see if you can guess why.

See Note 1 for the source of this data.
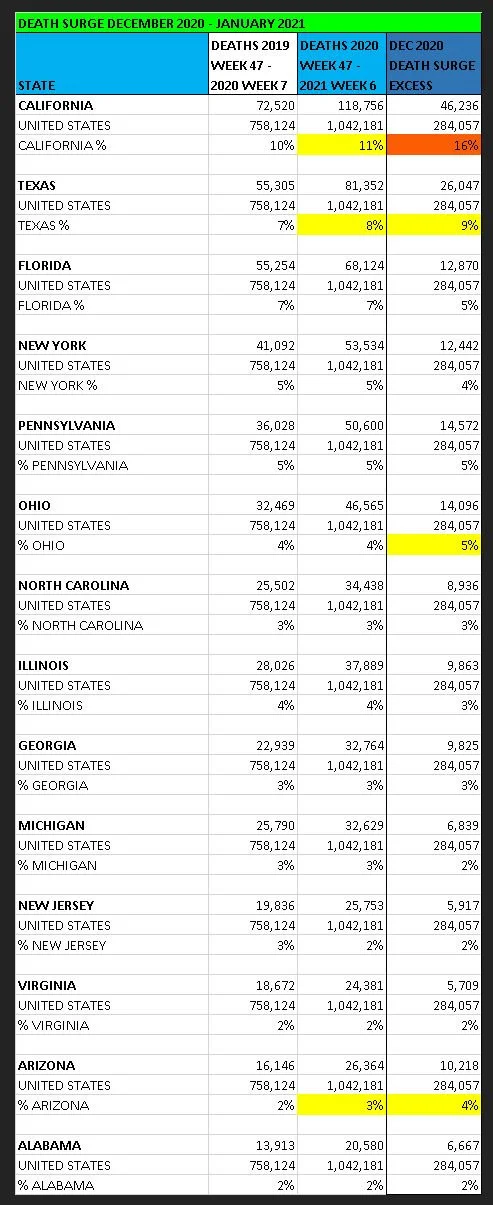
A closer look at the numbers showed that, as with the April 2020 death surge, deaths were higher overall in the US than they were a year earlier, but those increases were spread out over the states—so although deaths everywhere increased, there wasn’t really a “surge” in any state. The exception was California, which accounted for 16% of all the excess deaths in the US during this period—far more than its usual share of deaths.
There were mini death surges in Texas, Ohio and Arizona, but nothing compared to the monstrous load of death dumped on the state of California.
Again, I wonder what the creatures inhabiting the DOD basement know about this mass die-off event, which took the lives of more than 46,000 Californians over 13 weeks. They obviously are not big on sharing.
Observations
Based on what I’ve seen so far, I think we’re dealing with a few separate issues:
Something caused death rates across the US to increase dramatically starting around April 2020, continuing through 2021 and early 2022.
Something caused an extraordinary surge of deaths in New York and New Jersey in April 2020 that claimed the lives of approximately 55,000 people over 9 weeks.
Something caused an extraordinary surge of deaths in California in December 2020 that claimed the lives of approximately 46,000 people over 13 weeks.
I still have 2 more death surges to look into, one in August-September 2021, and one in January 2022.

Naturally, the CDC, inhabited as it is by CWACs (Creatures Without a Conscience), prefers not to discuss unpleasantries like these death surges. The same is apparently true of our noble protectors at the DOD. Naturally, whatever they had to say would be mostly lies, but they could at least go through the motions of making up reassuring platitudes, in exchange for their sweet government salaries and pension plans.
***
NOTES
TIP: To run a saved search in WONDER, click the link and agree to the terms of service. If the search does not run automatically, hit the Send button.
1) December 2020-January 2021 death surge. Run this search for 2020-2021 numbers. For 2019-2020 numbers, run this search. Citations and a table are below.