LAST UPDATE: February 22, 2024 (Originally published Sept. 3, 2021)
This page is solely for the objective documentation of United States mortality and Vaccine Adverse Event Reporting System (VAERS) data from the CDC WONDER database. The content of the CDC WONDER database is not a matter of opinion—everyone who performs the same search will obtain exactly the same results, every time. Most of the numbers shown here can be verified in the official database using saved search links provided in Notes. PLEASE NOTE: This page contains no analyses or conclusions about the data.
Contents
Introduction
Historical US population, deaths and death rate (1968-2023)
Deaths by age group
Excess deaths by age group
Deaths by state
Deaths by week (death waves)
COVID19 vaccine risk estimates (archived July 19, 2023)
COVID19 vaccines compared to others (VAERS reports)
Further reading
Useful links
Notes
All images on this page may be freely shared without alteration, including credit to virginiastoner.com.
***
Introduction
According to the CDC’s Advisory Committee on Immunization Practices (ACIP), VAERS is “the nation’s early warning system for vaccine safety.” See page 3 at this link.
Deaths in the United States increased dramatically starting in 2020, in all age groups except very young children. Mortality is tracked by the Centers for Disease Control (CDC) in the WONDER database. This page summarizes that mortality data by age group and state, and calculates the number of “excess deaths”—deaths over and above the expected number, based on historical data.
There have been more reports of death and serious injury from the COVID19 vaccines than from all other vaccines combined for the last 32 years. This information is tracked in the Vaccine Adverse Event Reporting System (VAERS), the only vaccine injury tracking system that is freely available to the public. Although reports to VAERS don’t prove the vaccine caused the injury, VAERS is “the nation’s early warning system for vaccine safety,” so this information is relevant to informed consent. This page summarizes the data on serious events and deaths reported to VAERS, and uses it to calculate the theoretical risk of COVID19 vaccination.
***
Historical US population, deaths and death rate
US population, deaths and death rate from 1968 thru 2023. See Note 10 for the source of this data, and a data table.
See Note 10 for the source of this data and a data table.
***
Deaths from all causes by age group
See Note 5 for the source of this data.
In general, the number of deaths increases with each decade of life; the only exception is babies under 1 year old, who die more often than other children under 15. The vast majority of deaths occur in people 45 years old and older, shown in this chart of yearly deaths from all causes. (5)
Historically, more deaths occur in winter than summer—although only for older people. This pattern is apparent in the more detailed monthly chart of deaths below.
In 2020-2023, there were several uncharacteristic surges in deaths, some occurring at unusual times of year, like spring and summer. Deaths by 10-year age groups are shown in the chart below of monthly deaths in the US since January 2015; at the top is summary of deaths in all age groups combined.
See Note 5b for the source of this data, and a data table.
***
Excess deaths by age group
To calculate excess deaths, average monthly deaths from the 5 year period from 2015-2019 were compared to monthly deaths from January 2020 forward; deaths over and above the 5-year average were considered “excess deaths.”
There have been excess deaths in all age groups except children under 5, shown in the chart below (5b). At the top is a summary of excess deaths since January 2020, followed by details about excess deaths in each age group, from oldest to youngest.
See Note 5b for the source of this data, and data tables.
***
Deaths by state
The chart below shows an overview of deaths in each state from 1999 through 2022. A dramatic disruption in the pattern of death in most states starting in 2020 is visually apparent. For a data table showing deaths from 2018-2023, see Note 11.
See Note 11 for the source of this data and a data table.
The following table shows the percentage change in deaths each year from 2000 through 2019, along with the percentage change in deaths over 2019 in the years 2020, 2021 and 2022. These percentages are shown in a red-yellow-green gradient, with the highest changes shown in red, and the lowest in green. The average yearly change from 2000 to 2019 was only 1%, while the average change over 2019 in years 2020-2022 was 17%, with some increases as high as 35%.
See Note 11 for the source of this data.
***
Deaths by week
Excess deaths in the US came in waves in 2020 and 2021. The chart below shows weekly deaths from 2020-2023 (in blue) compared to weekly deaths in 2019 (in brown). (12)
See Note 12 for the source of this data, and a data table.
Deaths during the waves occurred in different states at different times. The table below shows deaths by month and state in 2020 and 2021. In red are the states/months where deaths increased more than 60%, compared to the 2018-2019 average for that month. States/months were deaths increased less than 15% are shown in green. (13)
Be aware that deaths within each state may vary a lot county-by-county.
See Note 13 for the source of this data.
***
COVID19 vaccine risk estimates
NOTE: This section was archived July 19, 2023.
As of July 19, 2023, the CDC replaced its previous statement on COVID19 vaccine risk, the most recent of which is shown in the first chart below, with the following statement:
“Reports of Deaths after COVID-19 Vaccination
Multiple factors contribute to reports of death after COVID-19 vaccination, including heightened public awareness of COVID-19 vaccines, requirements under FDA authorization for COVID-19 vaccines that healthcare providers report any death after COVID-19 vaccination to VAERS (even if it is unclear whether the vaccine was the cause), and reporting requirements in CDC vaccine provider agreements. People receiving COVID-19 vaccines are less likely to die from COVID-19 and its complications and are at no greater risk of death from non-COVID causes, than unvaccinated people.
CDC scientists and partners have performed detailed assessments of deaths after COVID-19 vaccination and made the information available to healthcare providers and the public.”
The following 2 charts are now archived, with no further updates expected.
***
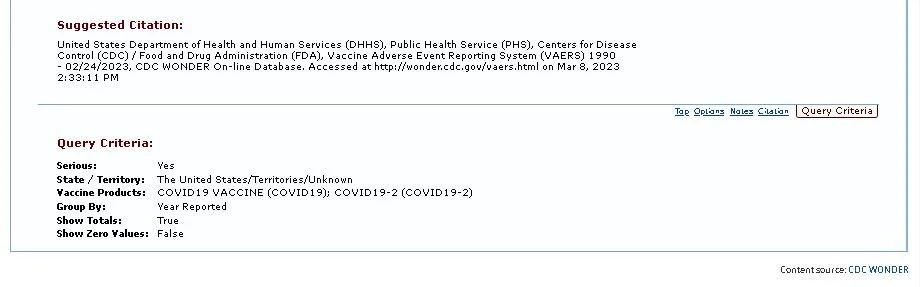
The CDC periodically issues a statement on the risk of COVID19 vaccination in the US, based on the number of shots administered and the number of deaths reported to VAERS, as shown in the following table. The CDC’s numbers were used to calculate risk 4 ways, with mathematical adjustments for VAERS underreporting and multiple doses of vaccine (explained below). The number of serious adverse events reported to VAERS from the COVID19 vaccines was obtained from a search of the VAERS database. (1)
See Note 1 for the source of this data.
Risk adjustments for VAERS underreporting
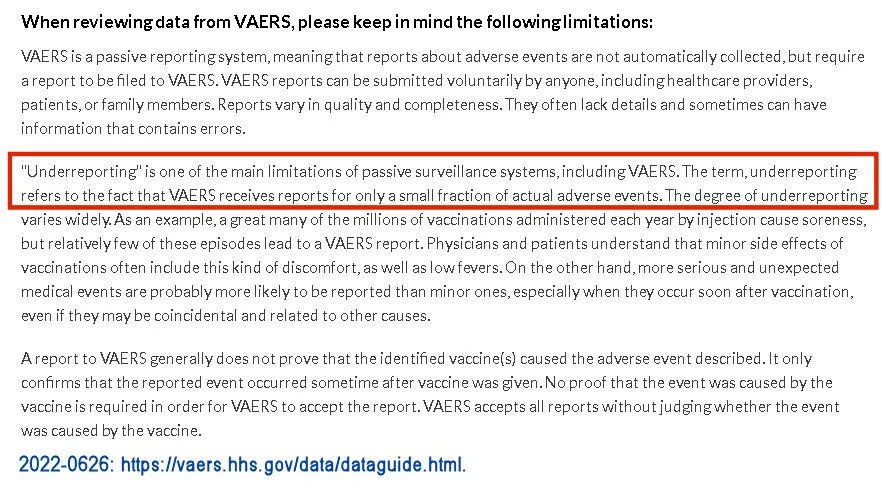
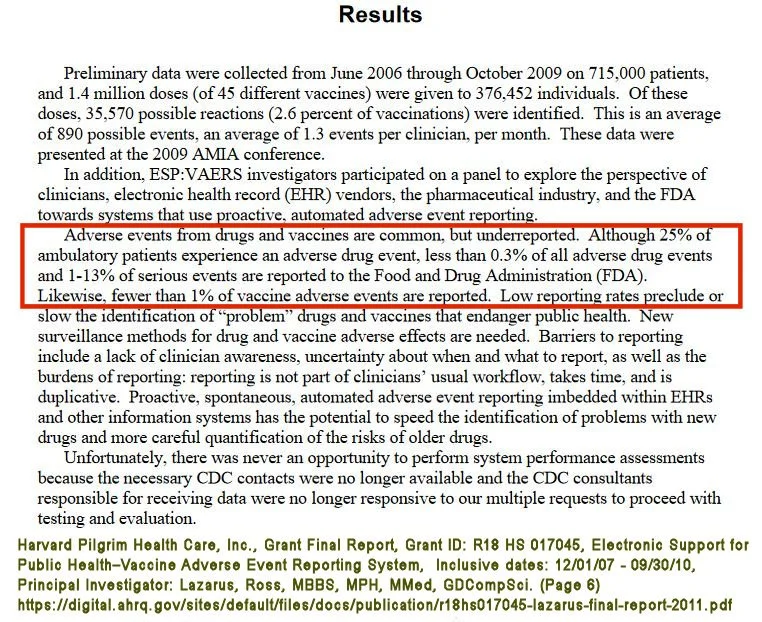
Only a “small fraction” of vaccine injuries are reported to VAERS (2) — possibly less than 1% (3). Even though medical providers are ‘required’ to report deaths after COVID19 vaccination, this unfortunately doesn’t mean that all, or even most, deaths are actually reported (9).
VAERS underreporting is sometimes described by the percent of vaccine injuries reported, and sometimes by the number to multiply by. Use either to select a risk estimate in the chart.
4 calculations of risk (probability)
The risk ratio, the percent risk, the odds (1-in-x risk), and the risk per 100,000 are 4 different ways of expressing the theoretical risk, or probability, that a COVID19 vaccine will result in serious injury or death.
The risk ratio is calculated by dividing the number of vaccine injuries by the number of vaccines administered; to get the % risk, multiply the result by 100. To get the risk per 100,000, multiply the risk ratio by 100,000.
The odds, or 1-in-x risk, is calculated by dividing the number of vaccines administered by the number of vaccine injuries.
IMPORTANT NOTE: These estimates do not take into account the following:
Coincidental injuries and deaths that may have been reported to VAERS, which would inflate the estimated risk.
How many vaccines each dead or injured person had, the age or state of health of the vaccinated person, or any other personal factors that could affect risk.
The calculated risk is per dose of vaccine
If multiple COVID shots are taken, the risks for each dose are added together, to estimate the risk that one of the doses will result in serious injury or death.
***
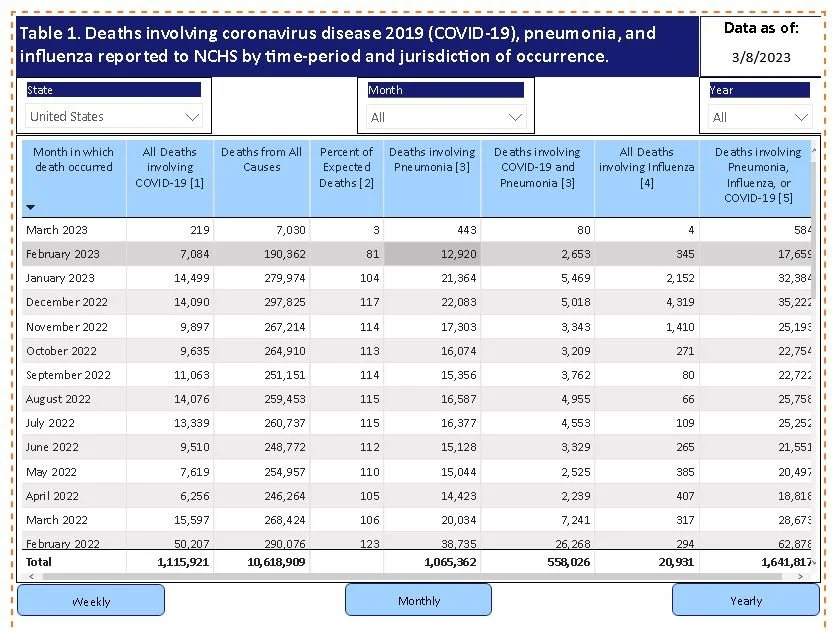
The CDC keeps a provisional tally of “deaths involving COVID19”, which is compared in the following chart to the estimated number of deaths involving vaccination. (4)
See Note 4 for the source of this data.
“Death involving COVID19” means the death occurred “with confirmed or presumed COVID19”. It doesn’t mean COVID19 was established as a cause of death—it means COVID19 was believed to be present at death. In other words, just as reports to VAERS don’t prove the vaccine caused the death, likewise, reports of “death involving COVID19” do not prove COVID19 caused the death.
***
COVID19 vaccines compared to others
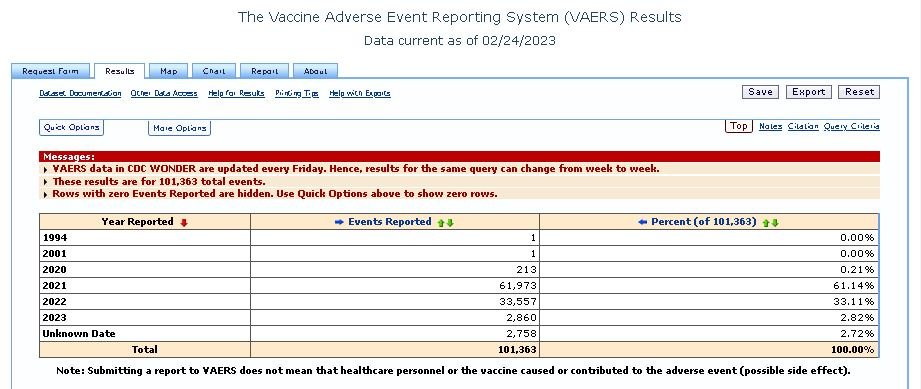
More deaths and serious injuries have been reported to VAERS from the COVID19 vaccines in the last 3 years, than from all other vaccines combined for the last 32 years (6 & 7).
See Notes 6 & 7 for the source of this data.
See Note 8 for the source of this data.
The increase in vaccine injuries reported to VAERS from COVID19 vaccines is not due to more vaccination
From 2019 through 2021, about half as many COVID19 vaccines were administered as other vaccines—yet the COVID19 vaccines resulted in 8 times more reports of serious injury and death. (8)
***
Further Reading
From Virginia Stoner’s blog:
Learn basic risk calculations in the second part of this paper.
Risk changes: How the vaccine risk numbers changed from May 2021 to April 2022.
COVID19 & Spanish flu: The similarities are uncanny.
***
Useful Links
Deaths involving COVID19: The CDC’s count of deaths involving COVID19.
CDC’S COVID19 vaccine risk page: Main page where the CDC makes statements about covid shot risks.
COVID19 vaccine data tracker: CDC’s record of COVID19 vaccines administered in the U.S., with demographics.
VAERS search: Search the Vaccine Adverse Event Reporting System (VAERS).
Search the CDC WONDER database.
***
Notes
INSTRUCTIONS FOR RUNNING SAVED SEARCHES: To run saved searches in the CDC WONDER database, click the link and agree to the Disclaimer/Terms of Service. For VAERS searches, select “VAERS data search.” If the search does not run automatically, click any “Send” button. Once the search runs you’ll be taken automatically to the “Results” tab. To see a detailed description of the search criteria, go back to the “Request Form” tab.
1) Estimated Risk of Serious Injury or Death from COVID19 Vaccination: (ARCHIVED as of July 19, 2023)
The CDC’s statement on covid shot risk is located here. The number of serious injuries reported from covid shots was obtained with a VAERS search shown below. Reports are classified as “serious” if any of the following occur: Death, Permanent Disability, Life Threatening, Hospitalized, Existing Hospitalization Prolonged, Congenital Anomaly or Birth Defect.
2) Only a “small fraction” of vaccine injuries are reported to VAERS.
That’s according to guidance on the VAERS website. VAERS is jointly managed by the Centers for Disease Control (CDC) and the Food & Drug Administration (FDA).
3) Less than 1% of vaccine injuries are reported to VAERS.
That’s according to research by Harvard Pilgrim Health Care, Inc. — Grant Final Report, Grant ID: R18 HS 017045, Electronic Support for Public Health–Vaccine Adverse Event Reporting System, Inclusive dates: 12/01/07 - 09/30/10, Principal Investigator: Lazarus, Ross, MBBS, MPH, MMed, GDCompSci.
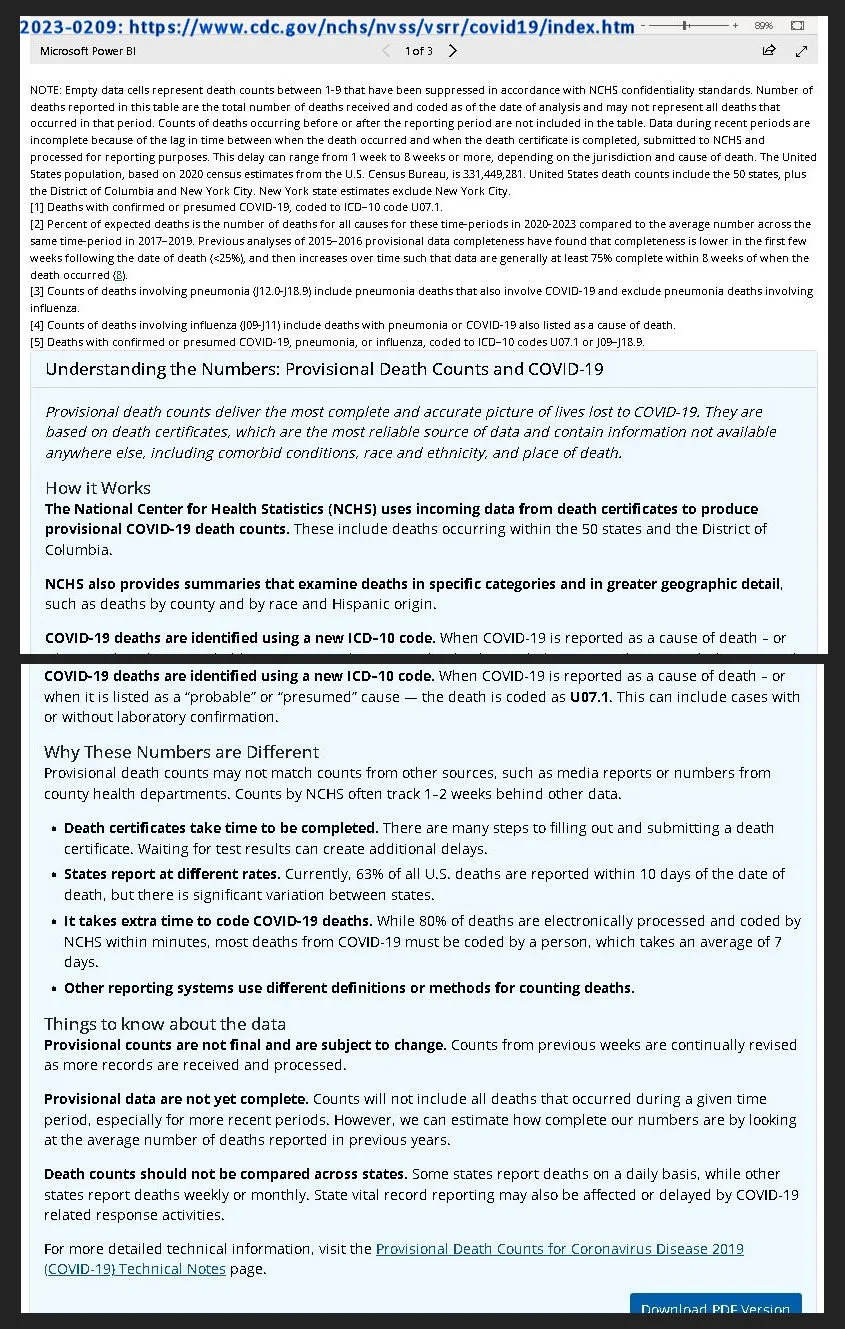
4) The CDC’s provisional count of deaths involving COVID-19 is found here. (ARCHIVED as of July 19, 2023)
“Involving COVID-19” means the person who died either tested positive for COVID-19, or was presumed to have COVID19, with no test (see Note 1 in the CDC screenshot below). In other words, it means the death occurred with COVID-19 believed to be present—not necessarily from COVID-19. Reports of “Death involving COVID-19” do not prove COVID-19 caused or contributed to the death.
CAUTION: The CDC, the media and others will often use this official count of deaths involving COVID-19, but call it something else, like “total deaths” or “COVID-19 deaths”, or some other name that disguises the fact there’s no proof these deaths were caused by COVID-19 or a virus SARS-CoV-2.
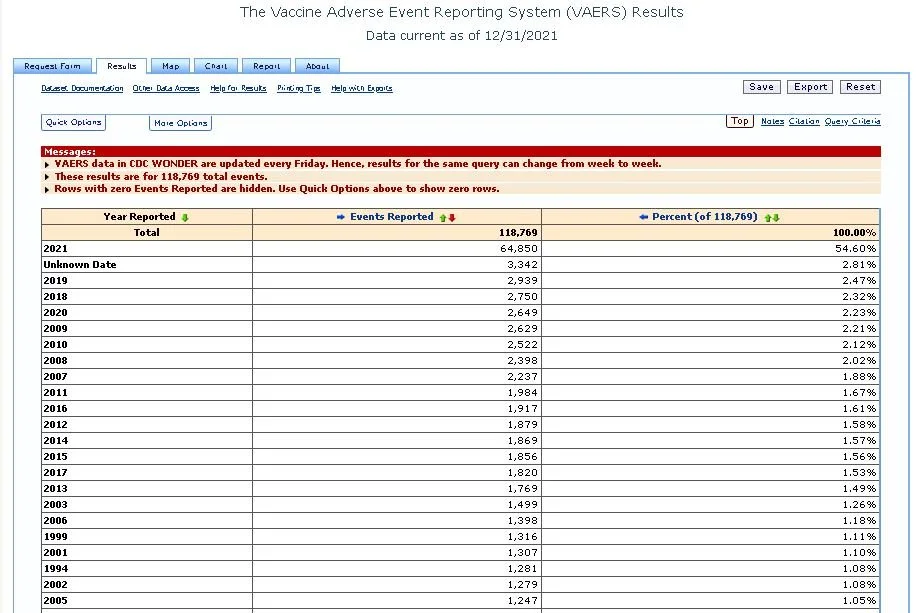
5) Deaths from all causes by age group and year:
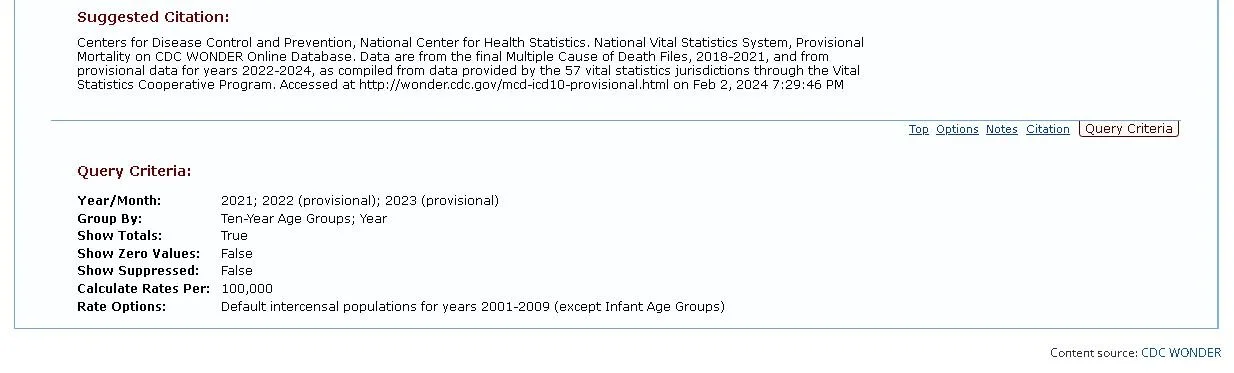
Citation for mortality data from 2021-present is below. Run this search.
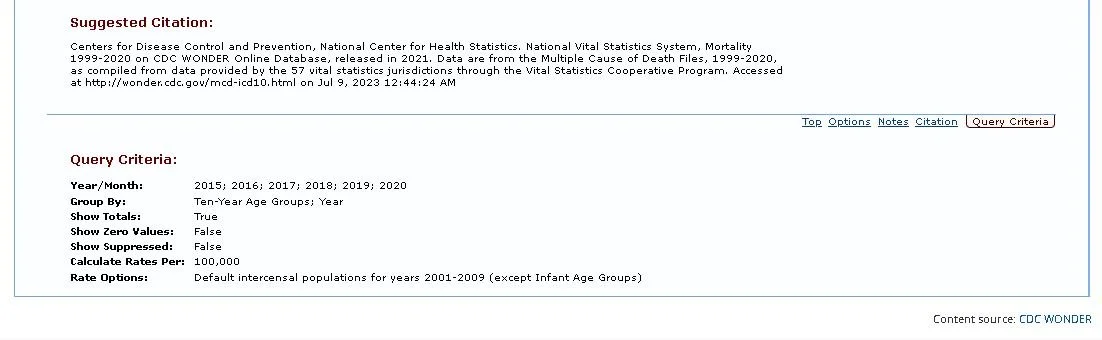
Citation for mortality data from 2015-2020. Run this search.
5b) Deaths by age group and month
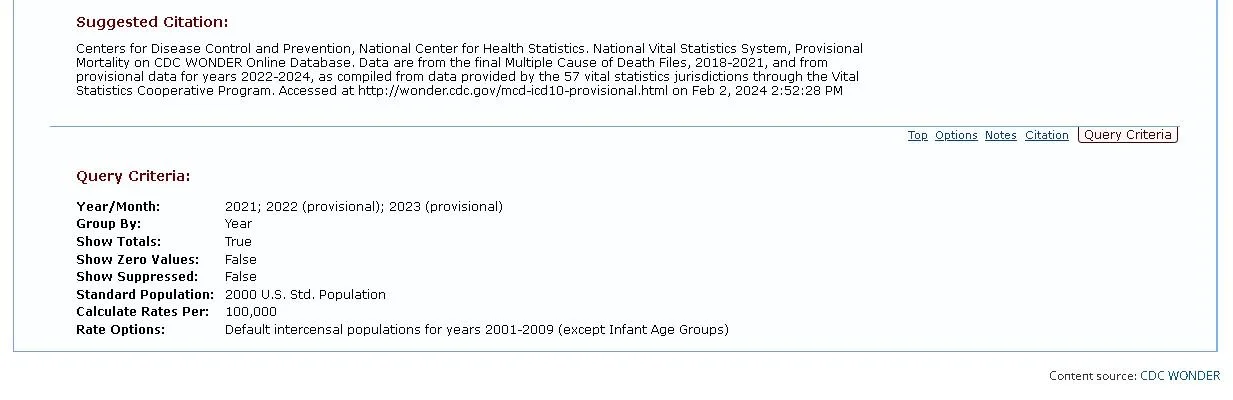
Citation for mortality data from 2021-2024 is below. Run this search.
Citation for mortality data from 2015-2020 is below. Run this search.

Table of deaths by month and age group, 2015-2024:
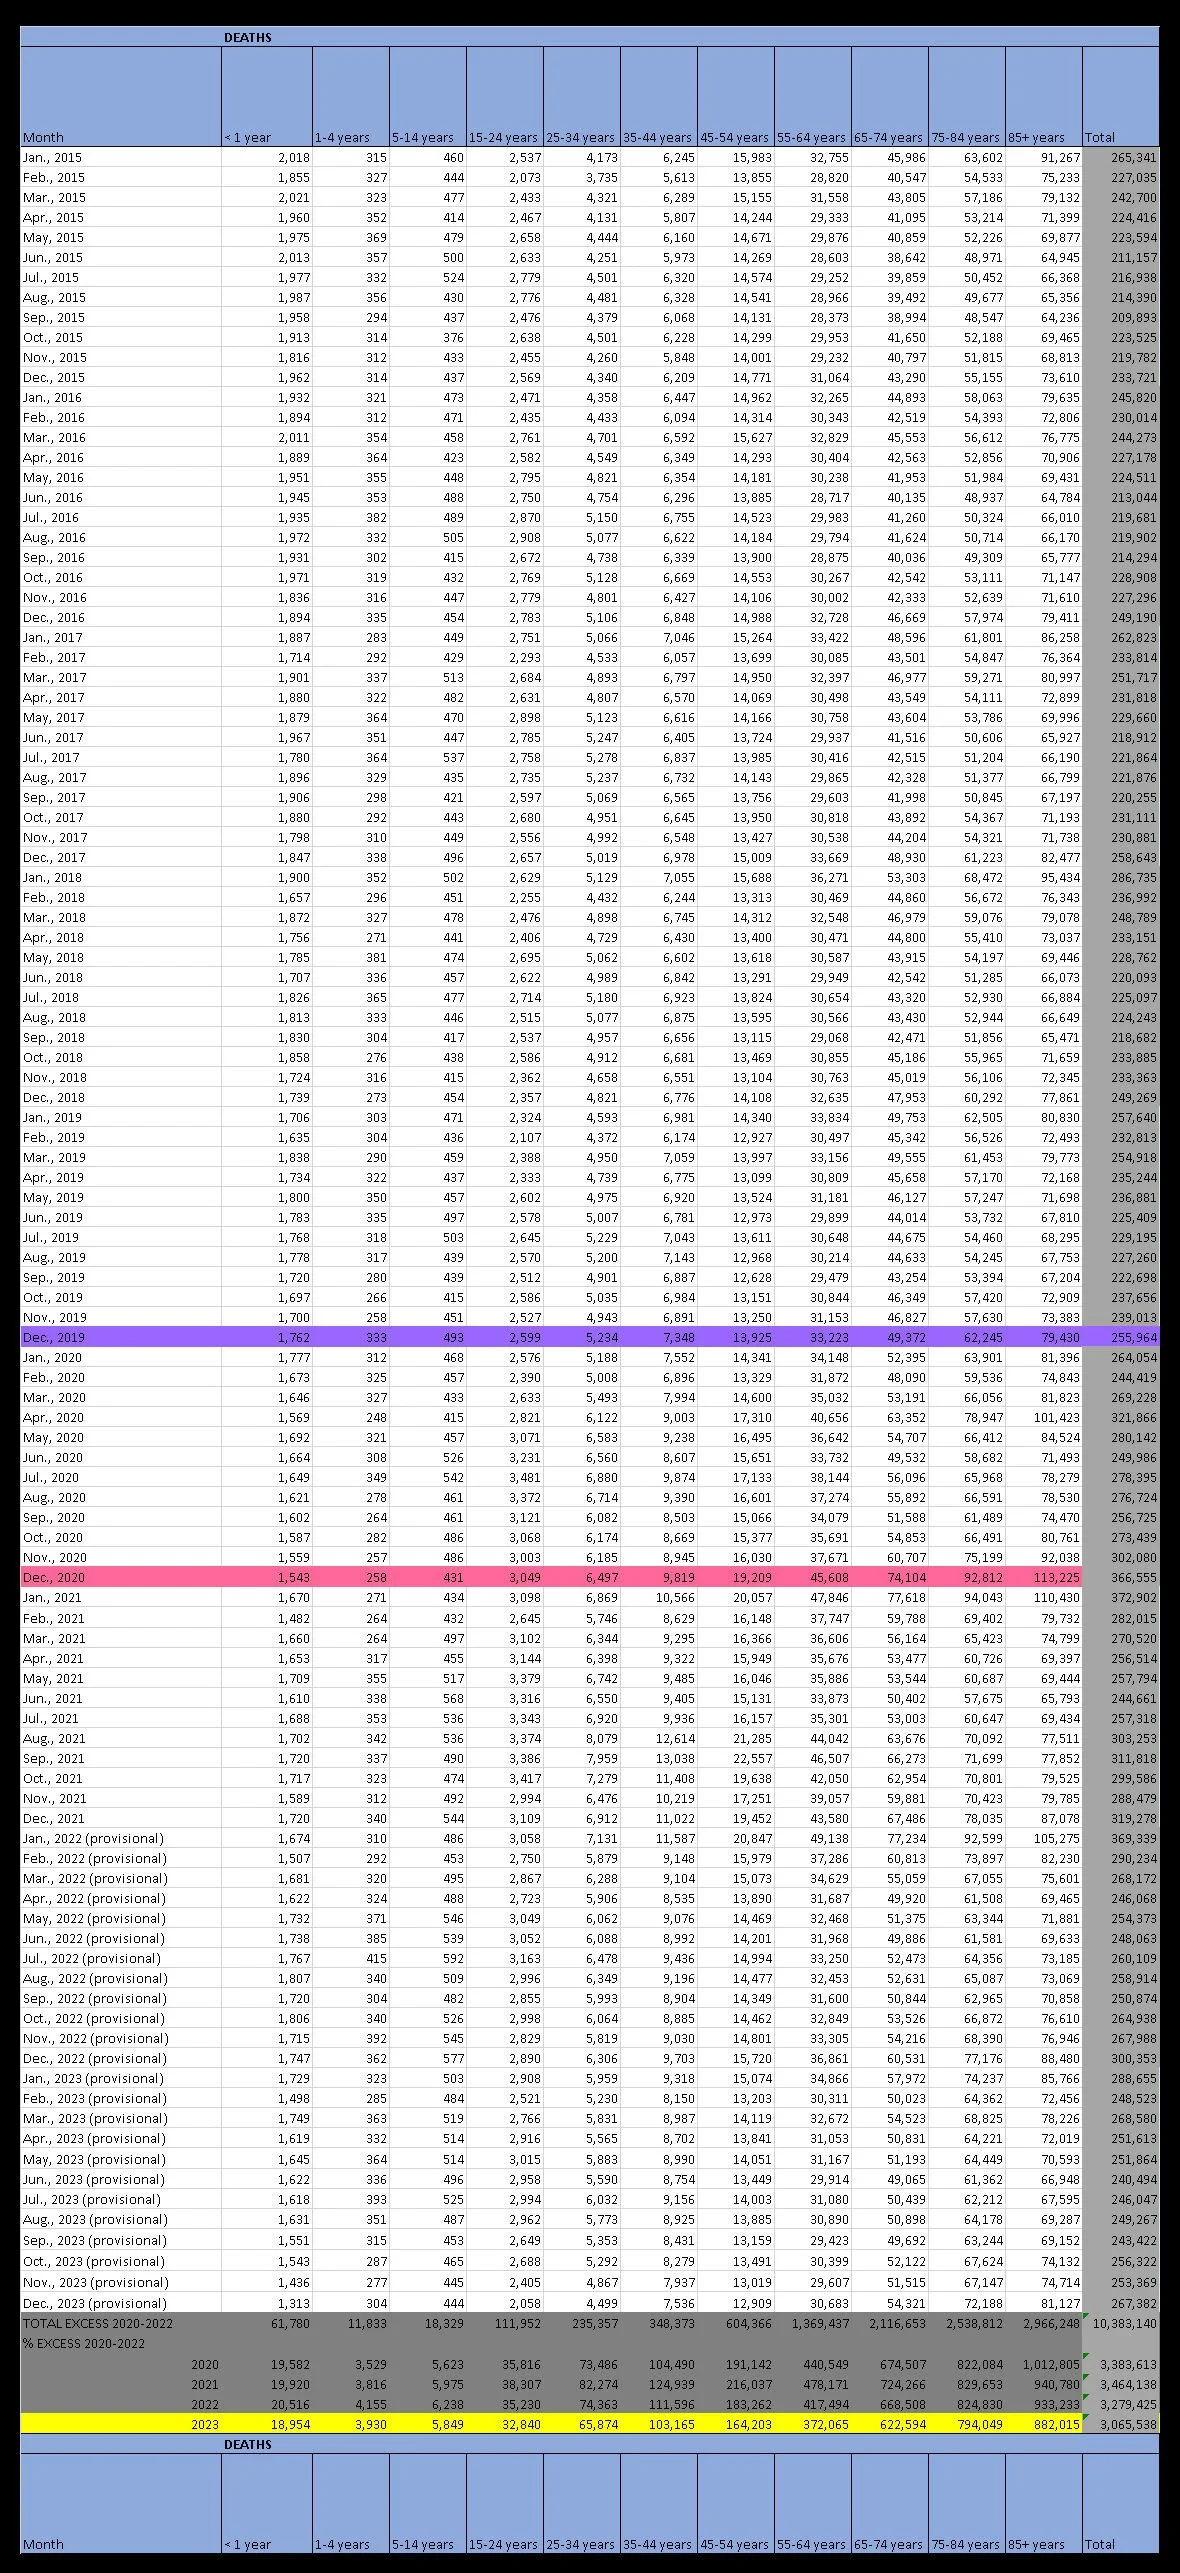
Table of average monthly deaths by age group, 2015-2019.

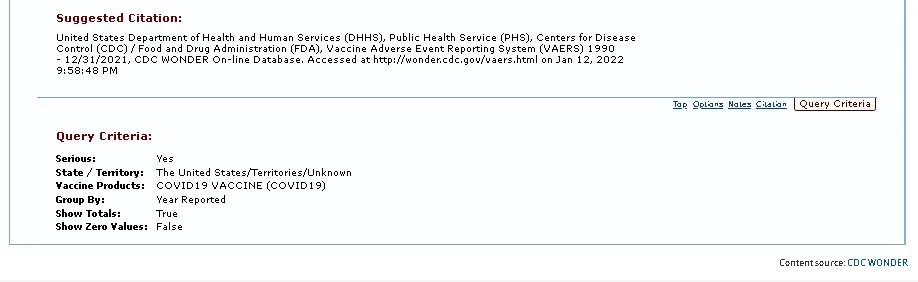
6) Deaths Reported to VAERS:
2 VAERS searches were done, one for all vaccine deaths and one for covid vaccine deaths; covid shot deaths were subtracted from the whole. For deaths reported from all vaccines, run this search. For deaths reported only from COVID19 vaccines, run this search. Citations are below.
7) Serious Events Reported to VAERS:
2 VAERS searches were done, one for all serious injuries reported and one for serious injuries from COVID19 vaccines, which were subtracted from the whole. Reports are classified as “serious” if any of the following occur: Death, Permanent Disability, Life Threatening, Hospitalized, Existing Hospitalization Prolonged, Congenital Anomaly or Birth Defect.
For serious events reported from all vaccines, run this search. For serious events reported only from COVID19 vaccines, run this search. Citations are below.

For monthly serious events reported to VAERS from COVID19 vaccines by month reported since December 2020, run this search. For monthly serious events reported to VAERS by month of vaccination, run this search. Citations are below.
8) Vaccines administered and serious events reported to VAERS:
The CDC’s COVID19 vaccination data is here. For other vaccines, the CDC’s estimates of the percent of people who got the flu vaccine were used to estimate the percent of people who were vaccinated according to the CDC’s schedule. That required census data found here; flu vaccine coverage data found here; and CDC vaccine schedule data for children and adults. This is an estimate only, and the 2021 estimate is based on 2020 flu vaccine coverage. 2 VAERS searches were done—one for serious events reported from all vaccines, and one for serious events reported from COVID19 vaccines, which were subtracted from the total.


9) Reporting deaths to VAERS is ‘required,’ but…
The CDC tells us the FDA requires healthcare providers to report any death after COVID-19 vaccination to VAERS. Unfortunately, that doesn’t mean all or even most vaccine deaths are reported, because:
First, the only deaths most vaccine providers will know about are the rare few that occur during the 15-30 minute monitoring period after the shot.
Second, there is no penalty for not reporting.
Third, medical providers don’t receive any compensation for the time required to make VAERS reports.
Fourth, there are no indications of improvement in the rate of VAERS reporting, while there are indications it’s as low as ever—such as this law firm letter written on behalf of a Physician Assistant at a regional New York hospital.
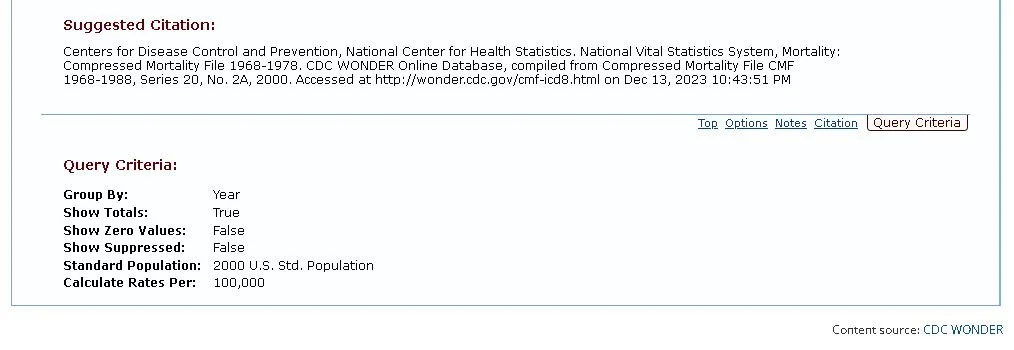
10) US deaths 1968-2023:
This data requires several different searches. A data table and citations are below. To run these saved searches in the WONDER database, use these links:
Compressed Mortality, 1968-1978: https://wonder.cdc.gov/controller/saved/D74/D371F474
Compressed Mortality, 1979-1998: https://wonder.cdc.gov/controller/saved/D16/D371F470
Underlying Cause of Death, 1999-2020: https://wonder.cdc.gov/controller/saved/D76/D371F467
Provisional Mortality Statistics, 2018 through Last Week: https://wonder.cdc.gov/controller/saved/D176/D377F422


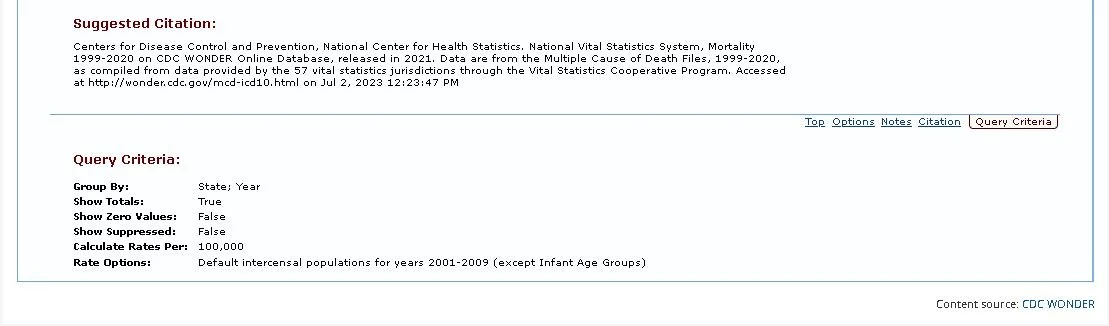
11) Deaths by state:
For deaths from 1999-2020, run this search. For 2021 deaths, run this search. For 2022-2023 deaths, run this search. A table of deaths and citations are below.


12) Deaths by week:
Citation and a data table are below. Run this search.

13) Percent increase in deaths by state and month in 2020 and 2021.
Citation for this search is below. Run this search.
